About The CMO
Developed by Tushar Chande in 1994, the Chande Momentum Oscillator (CMO) is a formula that calculates the difference between the value of recent gains and the value of recent losses and the result is divided by the sum of all price movement over the same period. This formula is a technical momentum indicator.
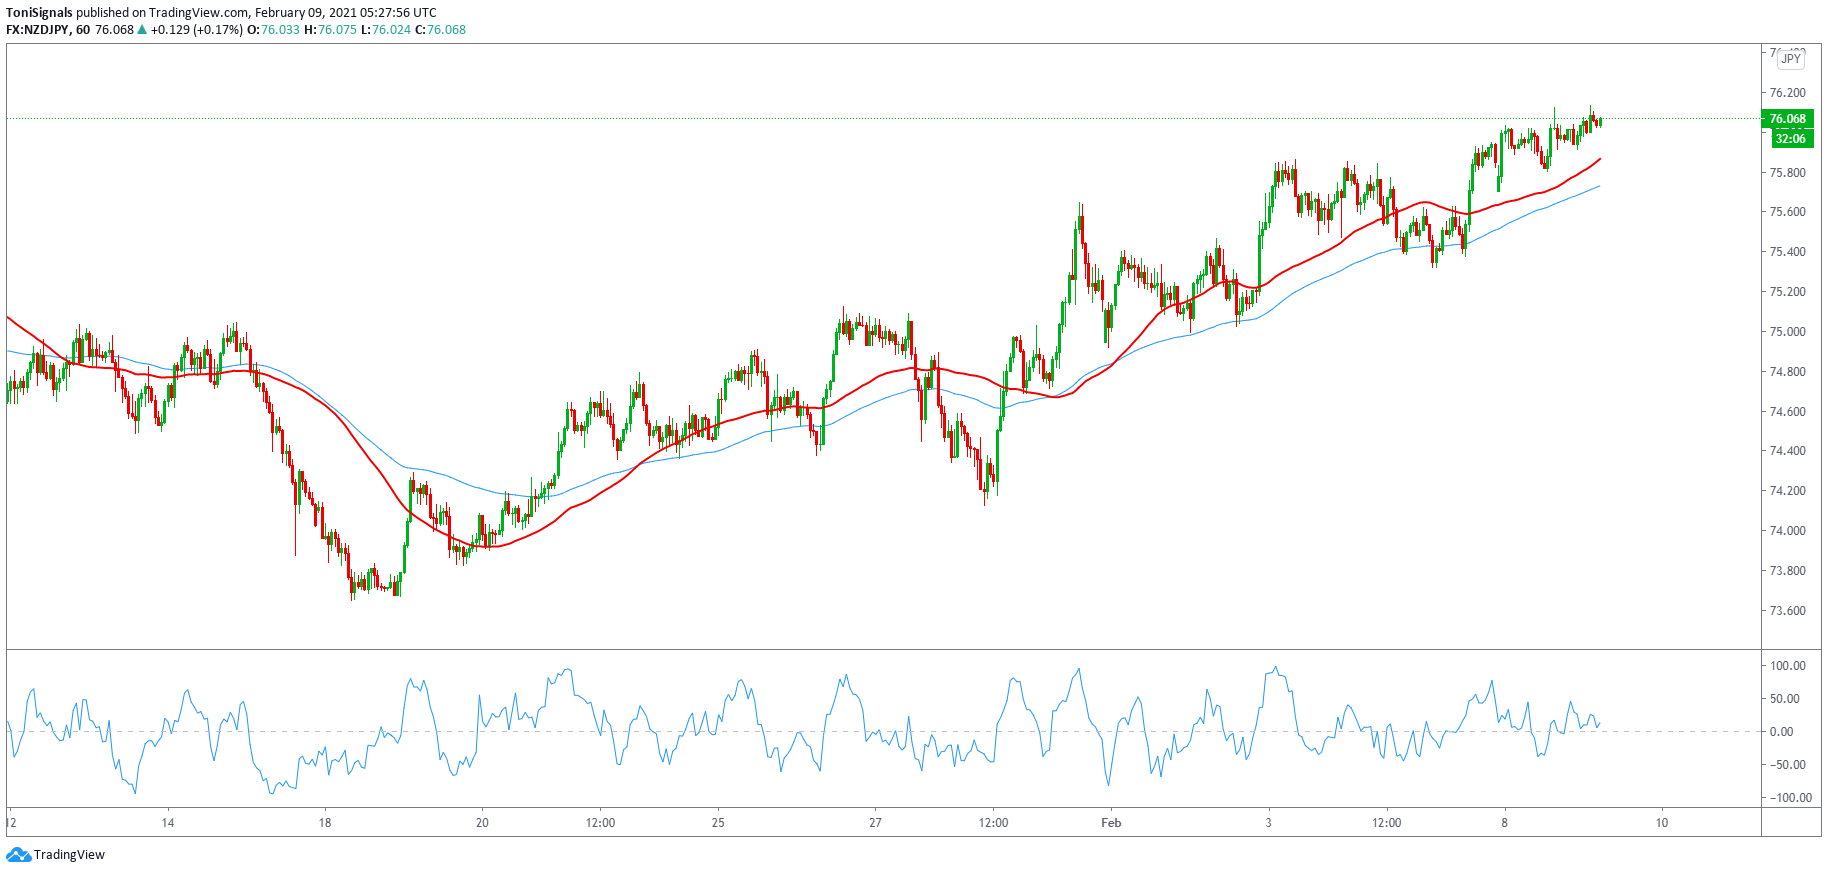
How We Use The CMO
The CMO measures momentum on up and down days, and it does not smooth results. In turn, this triggers more frequent oversold and overbought penetrations. The CMO indicator oscillates between +100 and -100.
To interpret the CMO, you will need to identify if it is above +50, which indicates that symbol is overbought. On the other hand, if security is below -50, it indicates that it has been oversold. To act as a signal line, it is recommended to add a 10-period moving average. The CMO acts as a bullish signal when it has crossed above the moving average, and a bearish signal when it drops below the moving average.
Another way of using the CMO as an indicator is when the signal crosses above or below the 0 line. An example of this is when you have a 50-day moving average that crosses above the 200-day moving average, a buy signal is confirmed if the CMO crosses above 0. This predicts that prices are heading higher. The strength of a trend can also be measured using the Chande Momentum Oscillator. This is indicated by the strength or weakness of the value of the CMO.
The Chande Momentum Oscillator may be used to identify positive and negative price divergence between an indicator and underlying security. If an underlying security is trending upward and the CMO is moving downward, that is indicative of a negative divergence. The opposite is true when price is downward and the CMO is moving upwards.