Check Out Todays Best Technical Setups
AUD/USD
1D Chart
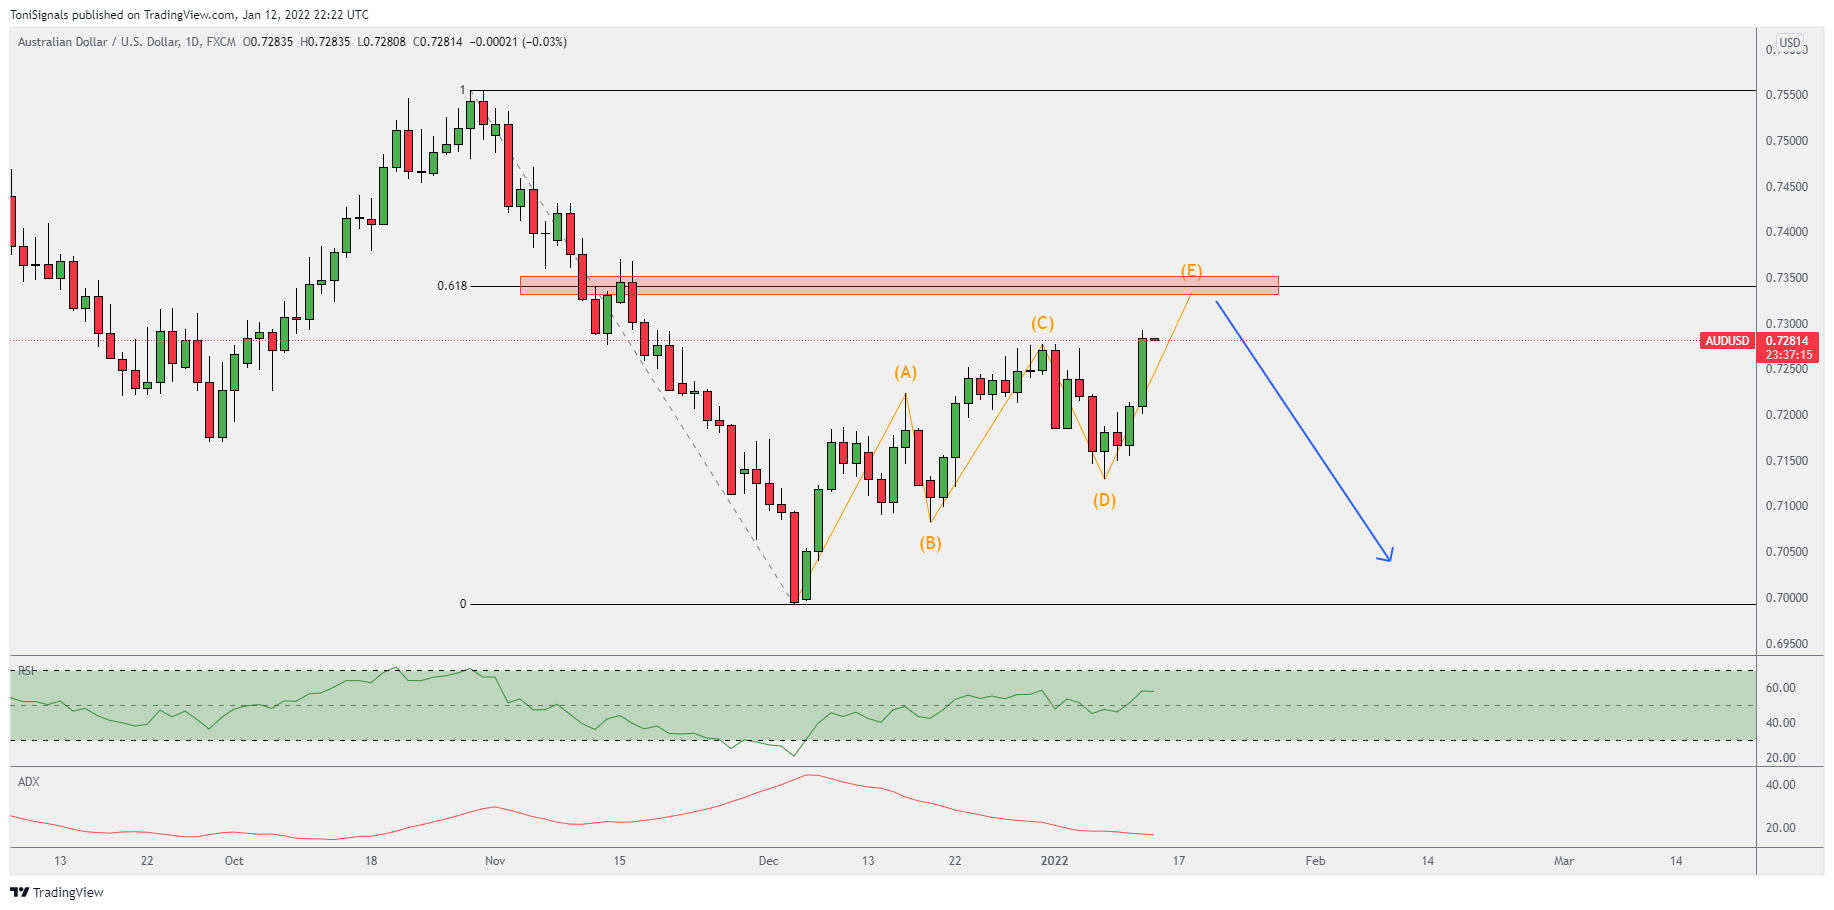
Price is in a bearish ABCDE correction pattern, and we're looking for this correction to move into the 61.8% fibonacci retracement level.
1H Chart
On the 1H chart we're looking for AUD/USD to make a pullback. Price has formed three bearish candles (three crows pattern), and the RSI is trading at overextended levels, both signalling a potential pullback. We're looking for price to pull back into the 0.7240 level.

GBP/USD
1D Chart
Price is trading to the upside aggressively, and has traded into a structure resistance zone. The RSI is showing overextended upside. We are seeing if price makes a pullback from this zone.

1H Chart
Price has topped out at the 1.3710 level, and the RSI has shown extremely overextended upside. We are looking for a short term retracement today into the 1.3600 level.

USD/JPY
1D Chart
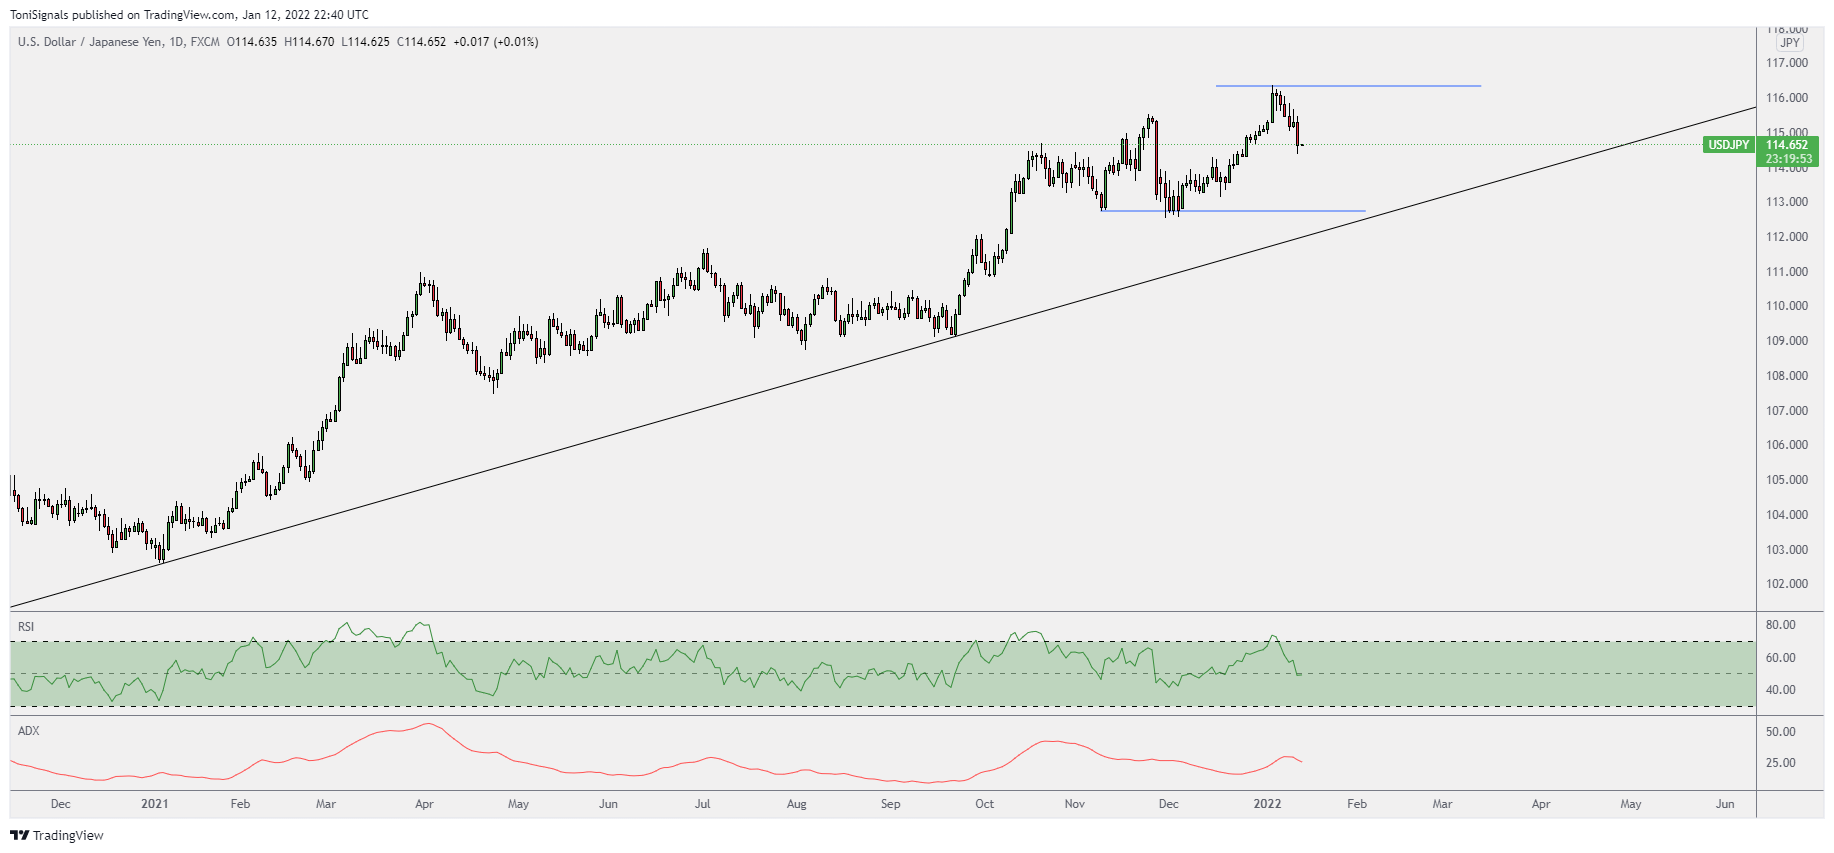
Price is in a long term uptrend, however the short term momentum is bearish, and we're looking for this bearish move to continue.
1H Chart
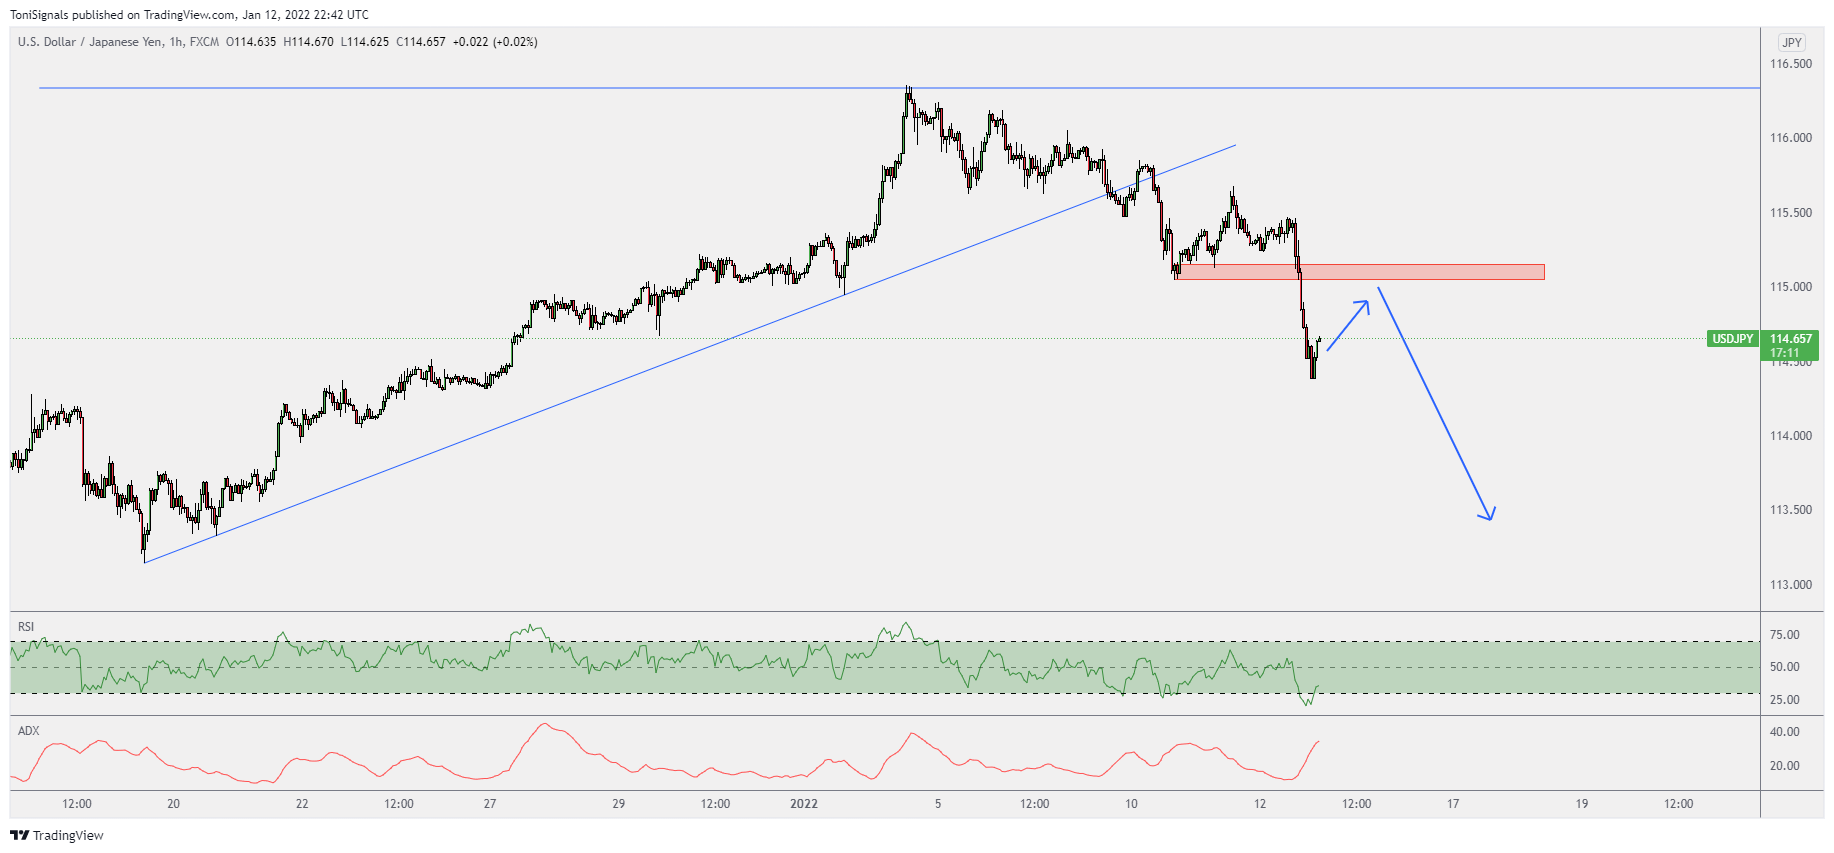
We're looking for a short term pullback, and continued downside into the 113.50 level. Price has broken the ascending trendline, and is in a bearish 1H structure.
XAU/USD
1D Chart
Price has broken the bullish structure, and has now pulled back into the resistance zone around the 1830 level. The RSI is showing bearish divergence and overextended upside. We're looking for downside from this zone now.
