What To Look For Ahead
We have seen the Aussie consolidate within the range over the last weeks trading and this is in line
with the other majors. All eyes are on the US and the upcoming election. With a plethora of
outcomes still possible it does feel like we are firmly in the calm before what could be a very large
volatility storm. Technical levels are also pointing to volatility if we see breaks of significant levels as
indicated below. On the domestic front, news that Victoria has at last seen some easing on Corona
virus restrictions has led to some optimism although this has yet to significantly influence the
currency.
Technical Levels
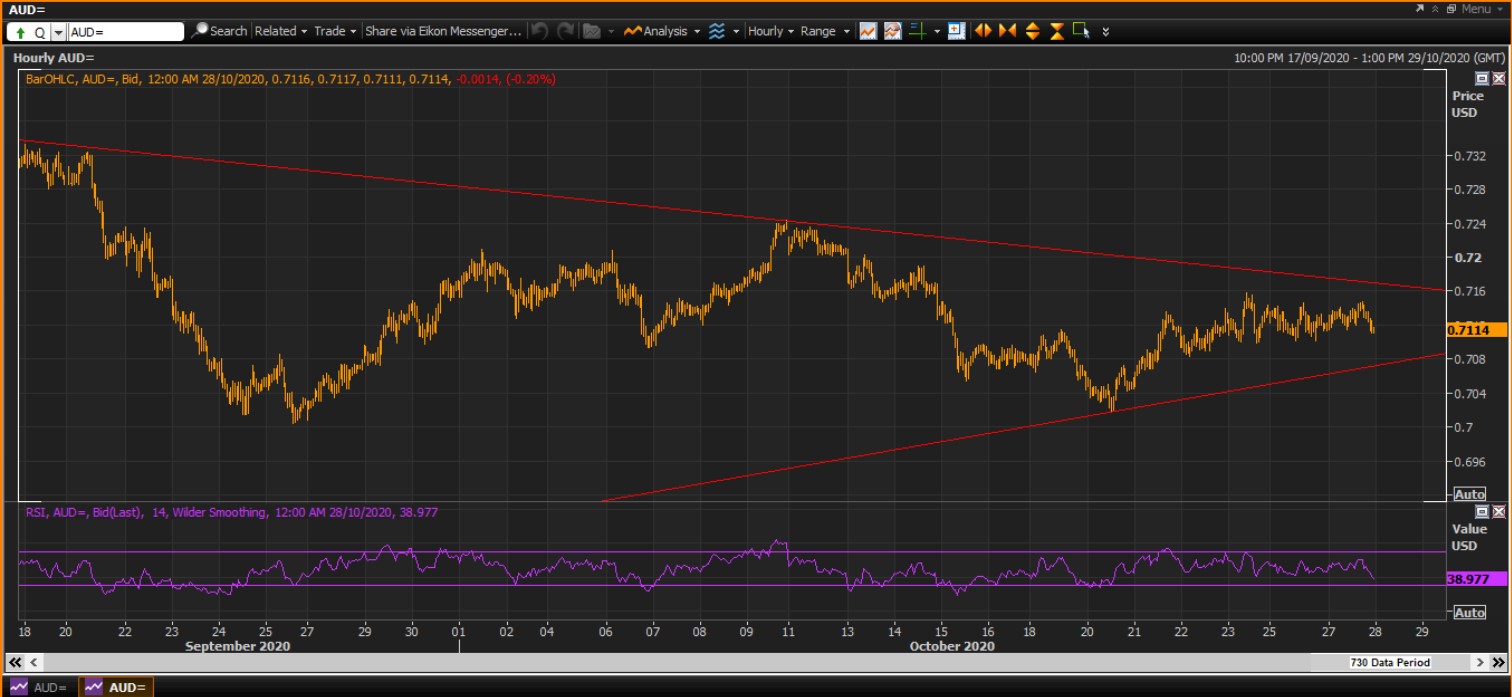
Hourly Chart
The Aussie has climbed off last week’s lows mainly on the back of a slightly more optimistic
sentiment permeating through the market, although as mentioned above we are still very much
range bound. Trendline support now sits around 0.7075 with last weeks low at 0.7018 the next
target. On the topside trendline resistance now comes in around 0.7175 with the previous weeks
high at 0.7243 the next level higher.
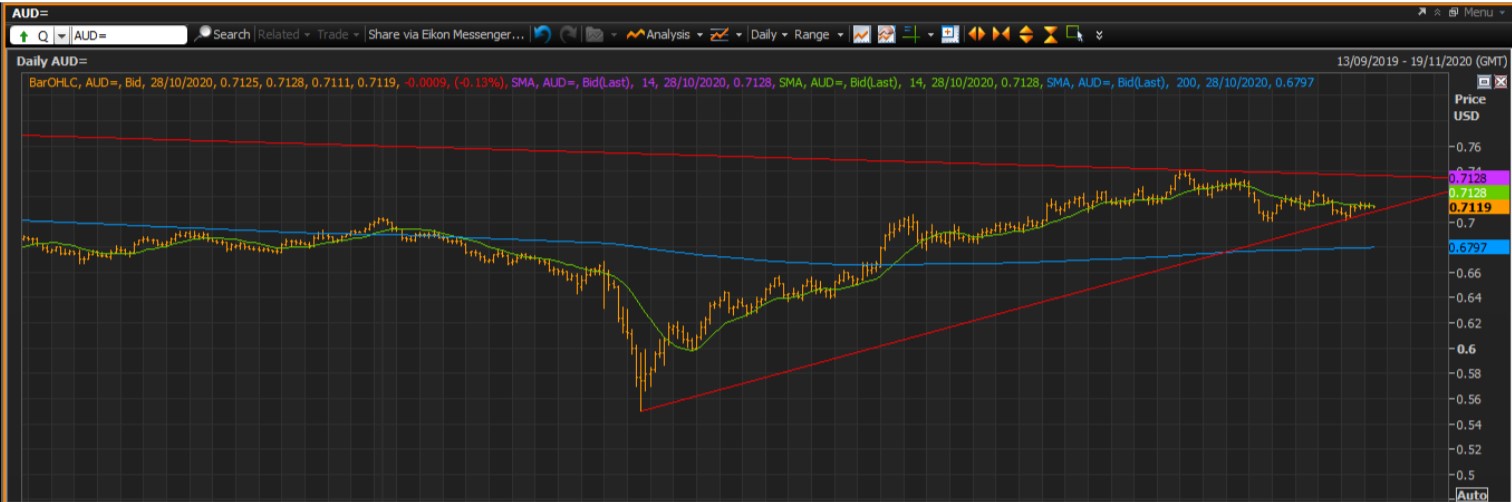
Daily Chart
On the longer-term chart, trendline support from the March low is creeping up to current levels and
it now coincides with the next level of support on the hourlies at 0.7075. A firm break here opens
the way for a good move lower with the next levels down at the 200-day moving average, now at
0.6797 and the 61.8% Fibo level of the March to September move below that at 0.6672. On the
topside, trendline resistance now sits at 0.7380, still not far off the yearly highs at 0.7412. Similarly
on the topside a break here opens up the possibility to another step up to a new range.