Here's The Charts We're Looking Into
It's the first of November and here is what we're looking at for the month to come!
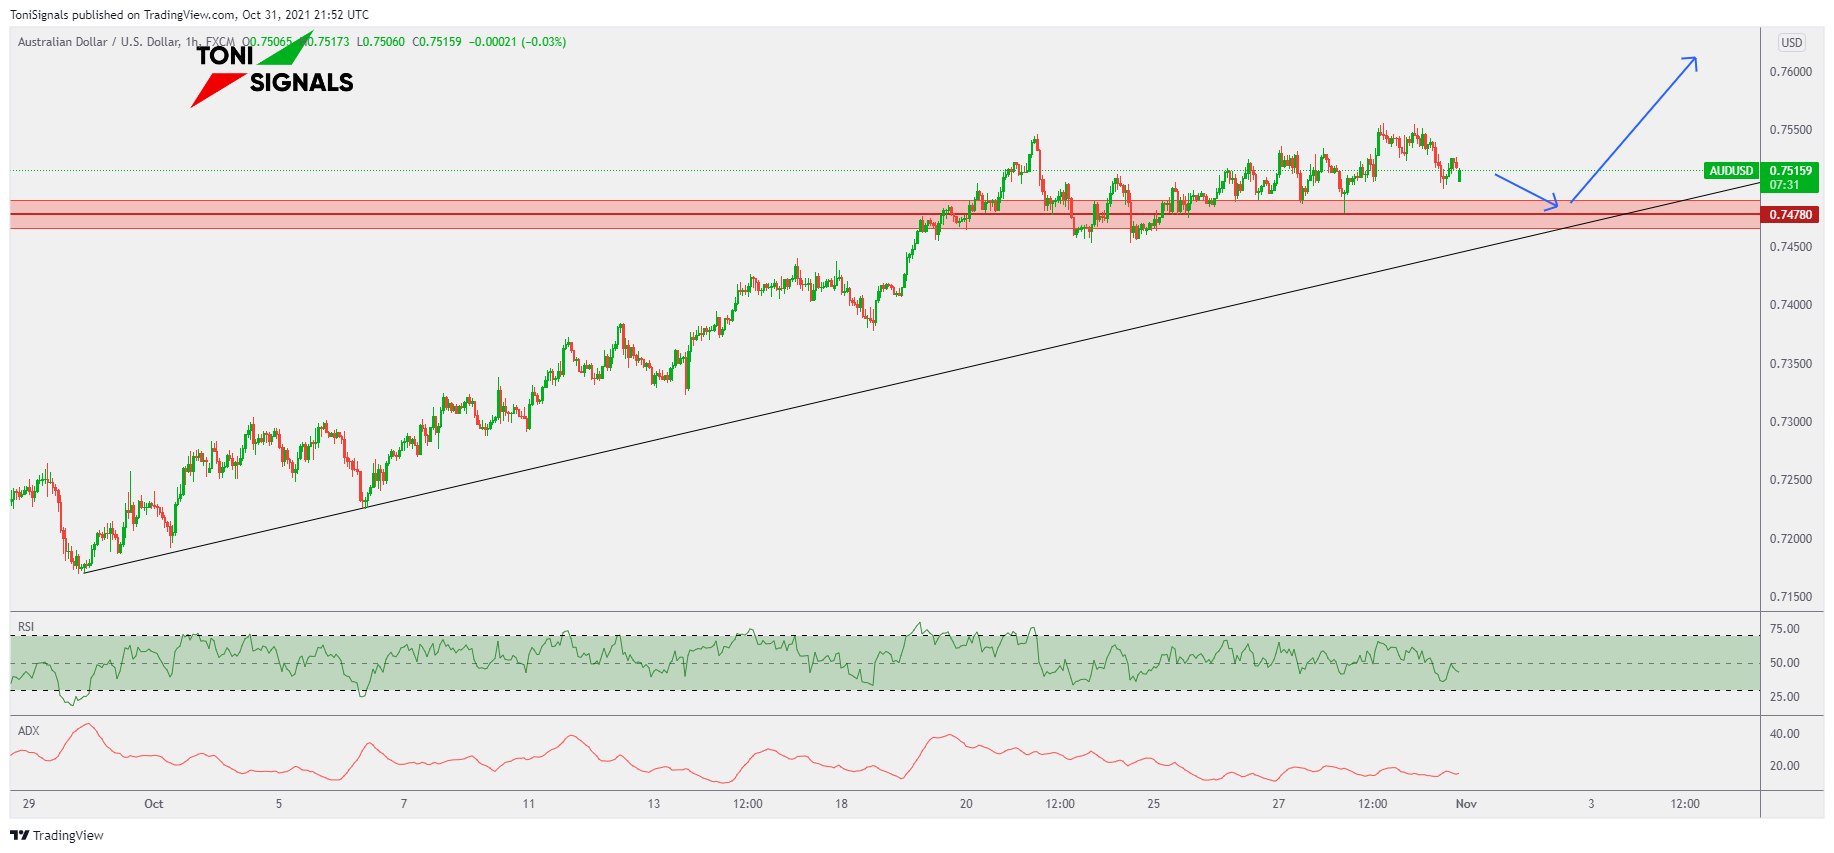
AUD/USD
1D Chart
Price is holding in the bullish structure, and we continue to look for upside. We are anticipating some form of retracement into the broken structure again after friday's bearish close.

1H Chart
Price is pushing to the upside but has gapped down at the market open. We are looking for the gap to close and then a push to the downside into support at the 0.74780 level.
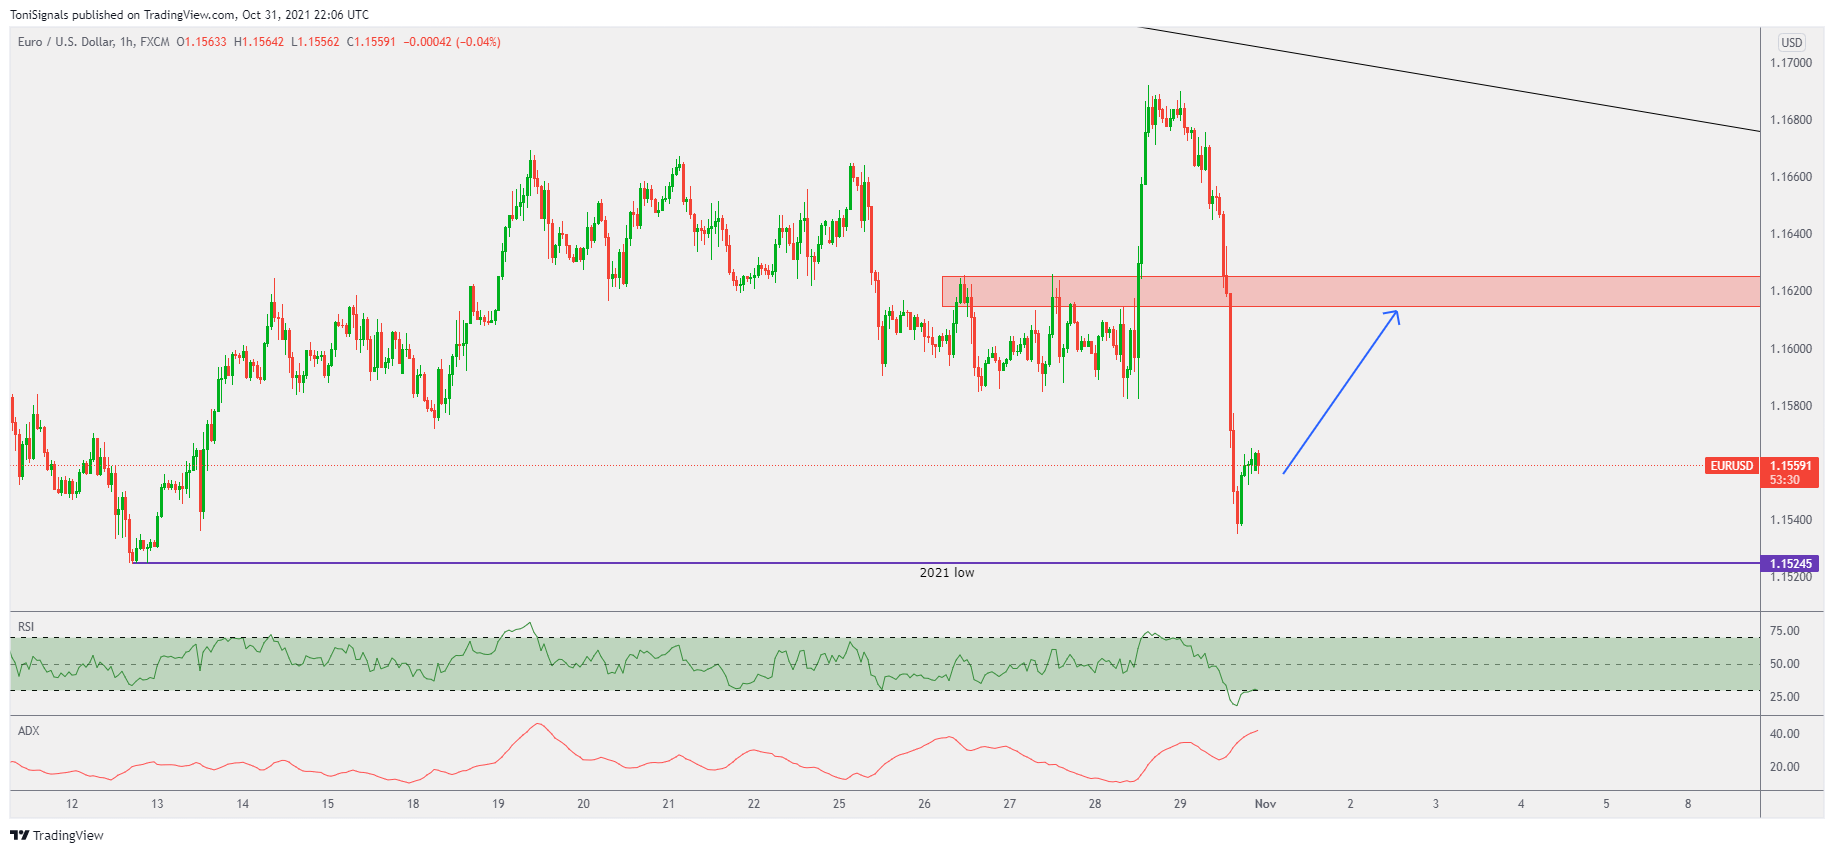
EUR/USD
1D Chart
EURUSD has bounced from the resistance zone & trendline on the daily chart, and we are looking for downside to continue through the current yearly lows.

1H Chart
Friday trading saw EURUSD move to the downside, forming a candle imbalance. We now anticipate an upside move to recover from this, prior to further downside.
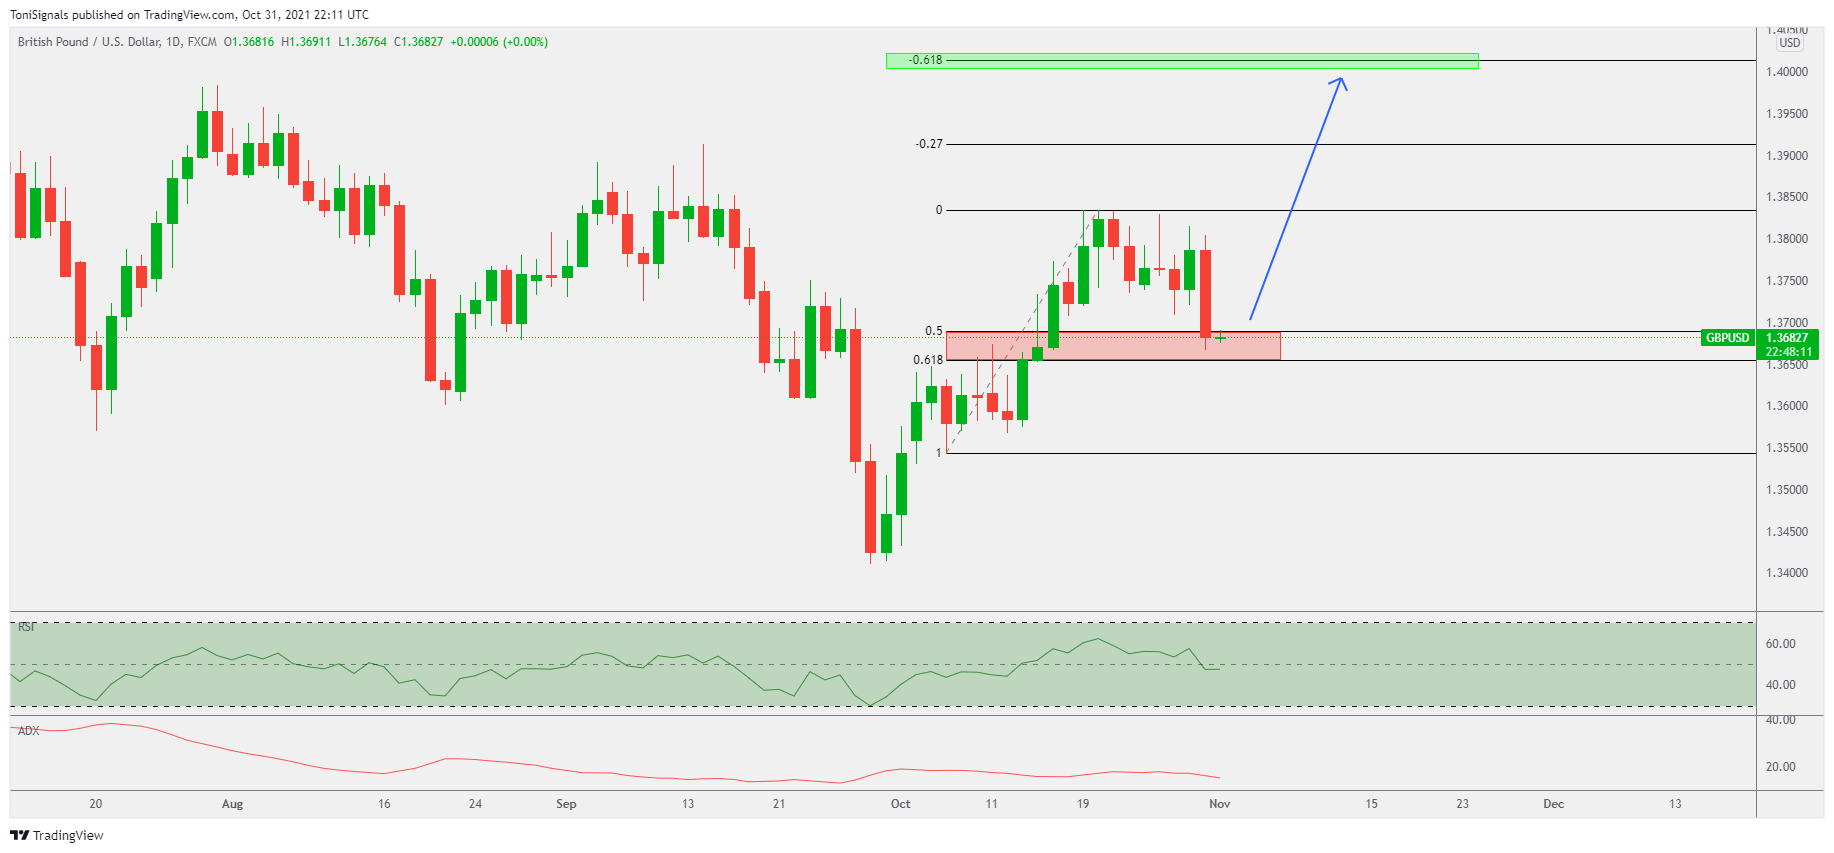
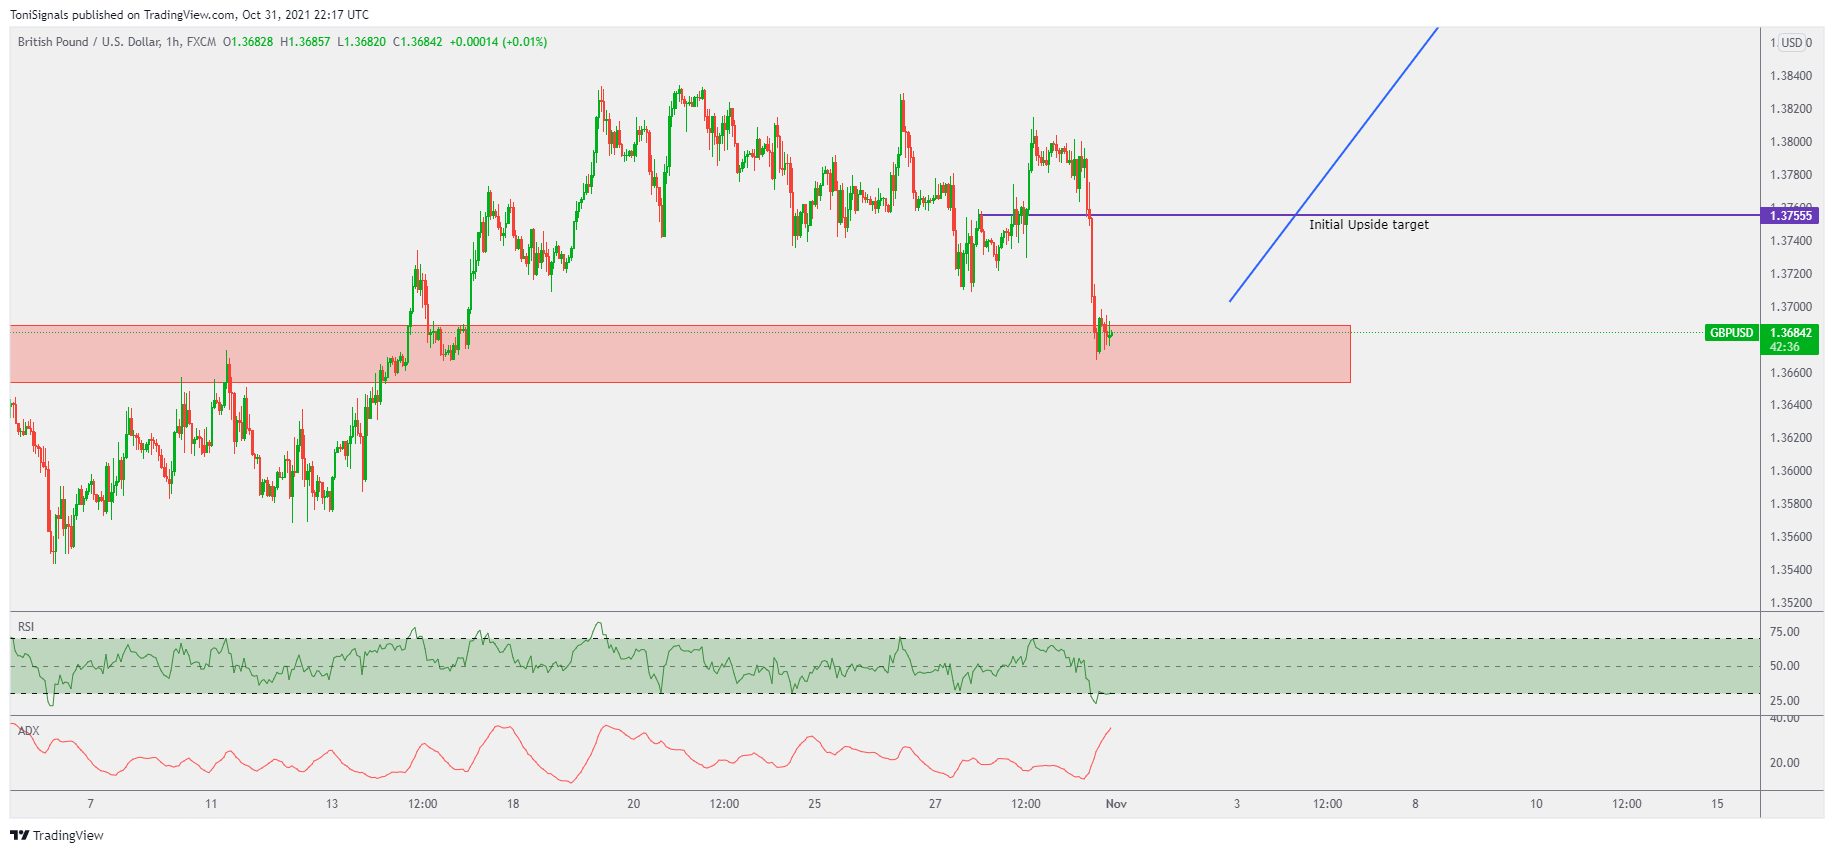
GBP/USD
1D Chart
GBP/USD has traded into the daily Fibonacci golden pocket zone as support. We are anticipating price bounce from this zone, and looking for long term upside above the 1.400 mark on the pair.
1H Chart
On the 1H Chart price has clear bearish momentum however is finding support. The RSI has generated an oversold signal as well, and there is an imbalance candlestick pattern. For these reasons we are anticipating a retreat into the 1.3755 level in the short term.
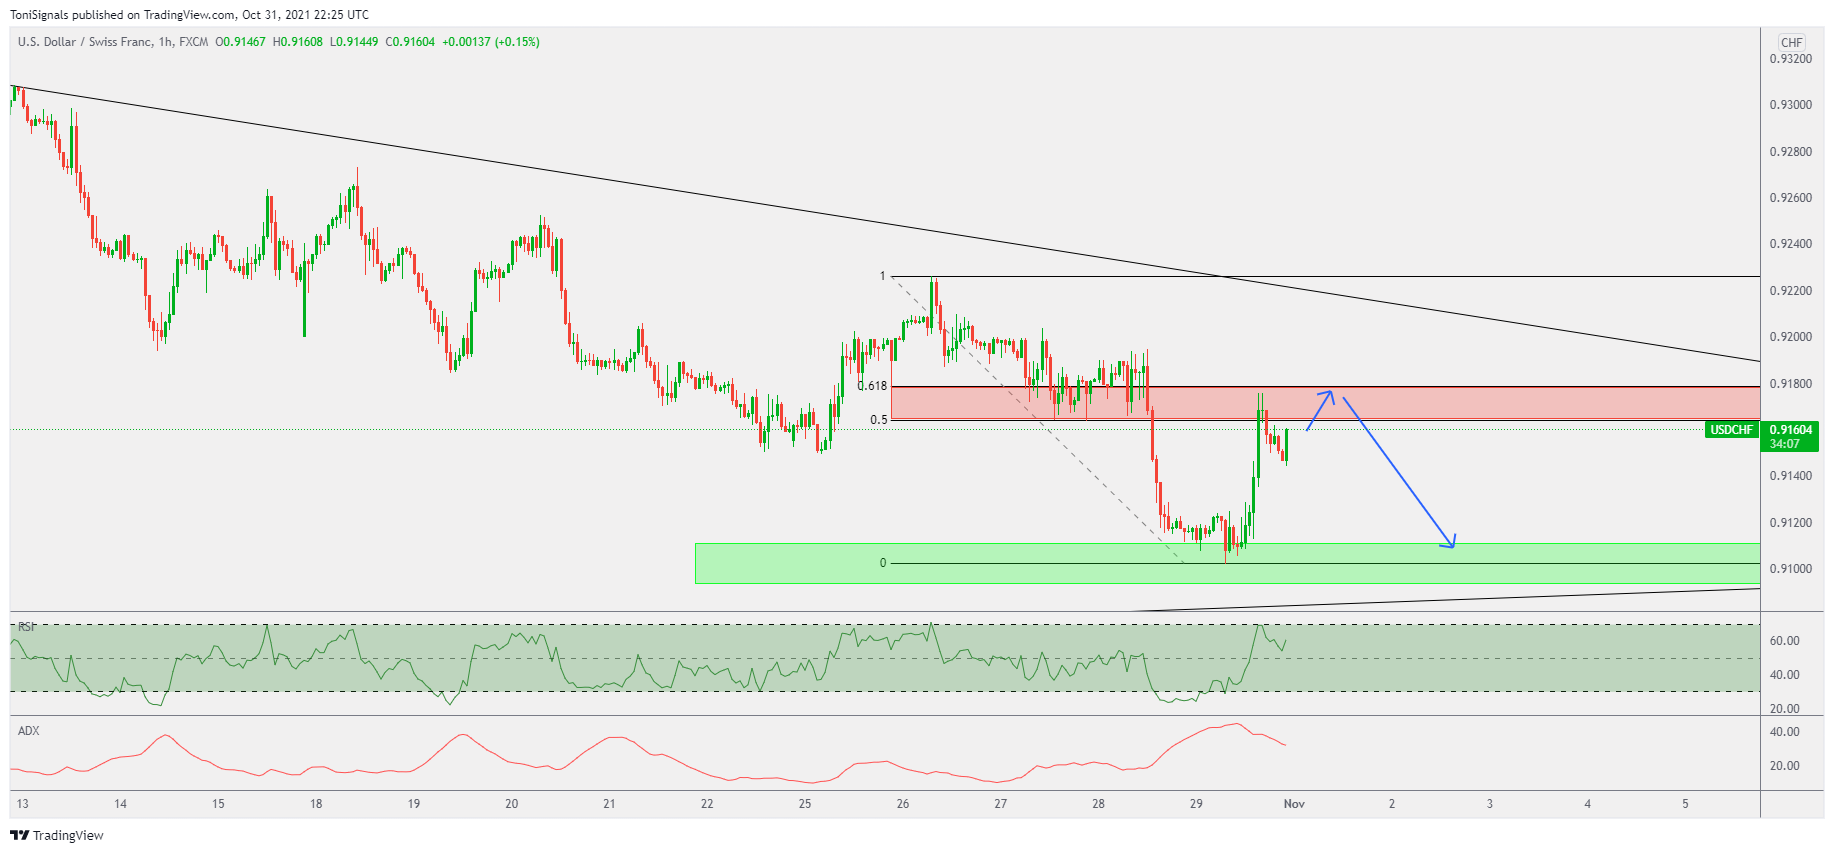
USD/CHF
1D Chart
Price has made a retracement on Friday and is pulling into the fibonacci golden pocket zone now. We anticipate this to hold as resistance, and will be looking for price to trade downside into the support trendline and recent lows.
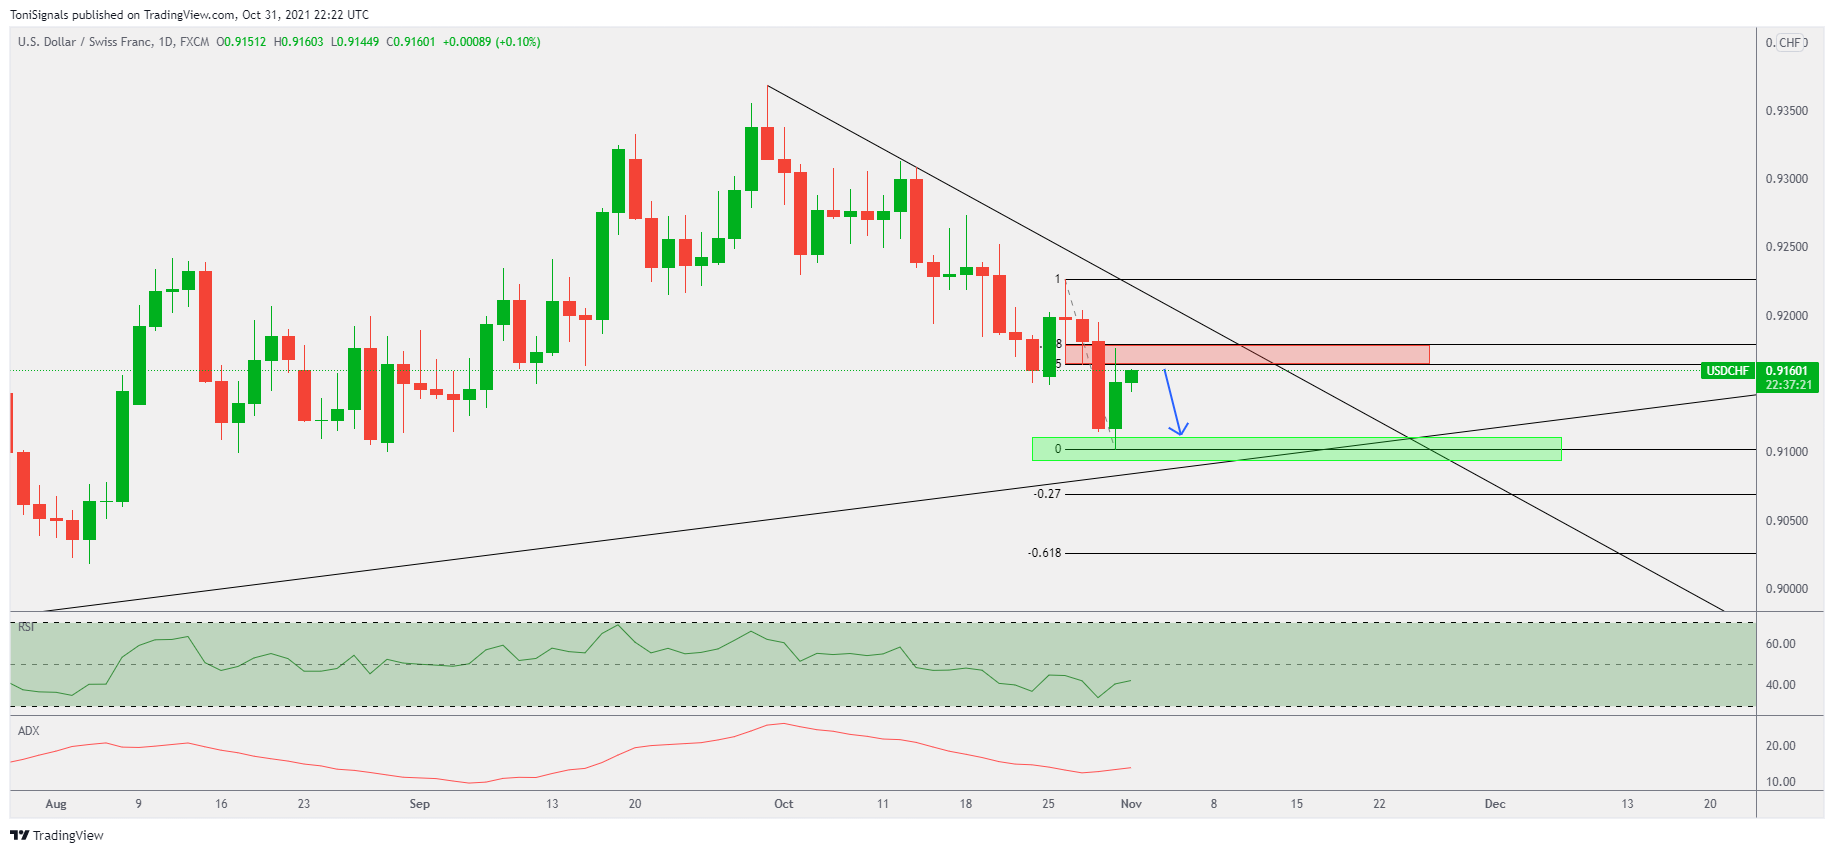
1H Chart
On the 1H chart we're looking for a slightly deeper retracement, anticipating price to tap the 61.8% retracement level as resistance. From here we anticipate a bounce and a continued move to the downside.