What Charts Are Hot
AUDUSD & GBPUSD have confirmed breakouts, EURUSD forms inside candle and XAUUSD stays ranging.
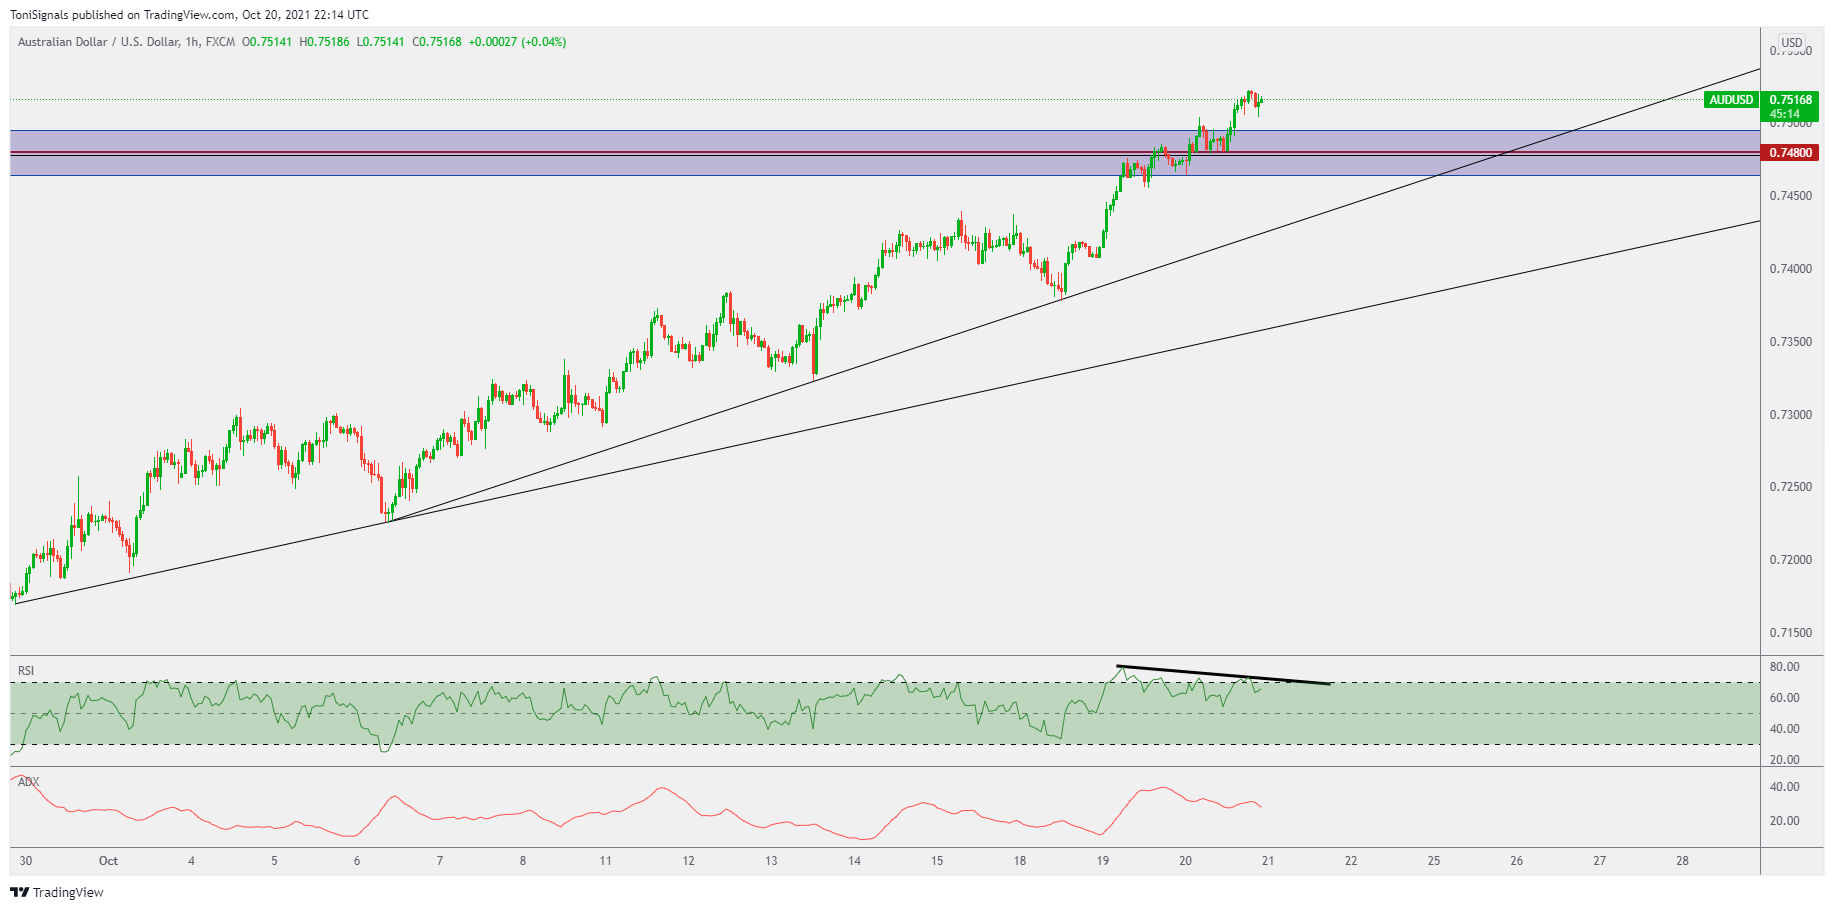
AUDUSD
1D Chart
AUDUSD has broken above the resistance level at 0.74800 and we now anticipate upside to continue into the 61.8% fibonacci extension around 0.7700. We may see a retest of this zone first.

1H Chart
The RSI is forming bearish divergence and we're expecting some type of correction to occur.
EURUSD
1D Chart
EURUSD has formed an inside bar continuation pattern after breaking the descending wedge pattern. We anticipate the upside to continue into the resistance area marked in red.

1H Chart
Price has bounced from the structure we outlined in yesterdays breakdown, and we anticipate continued upside today to break above yesterdays highs.

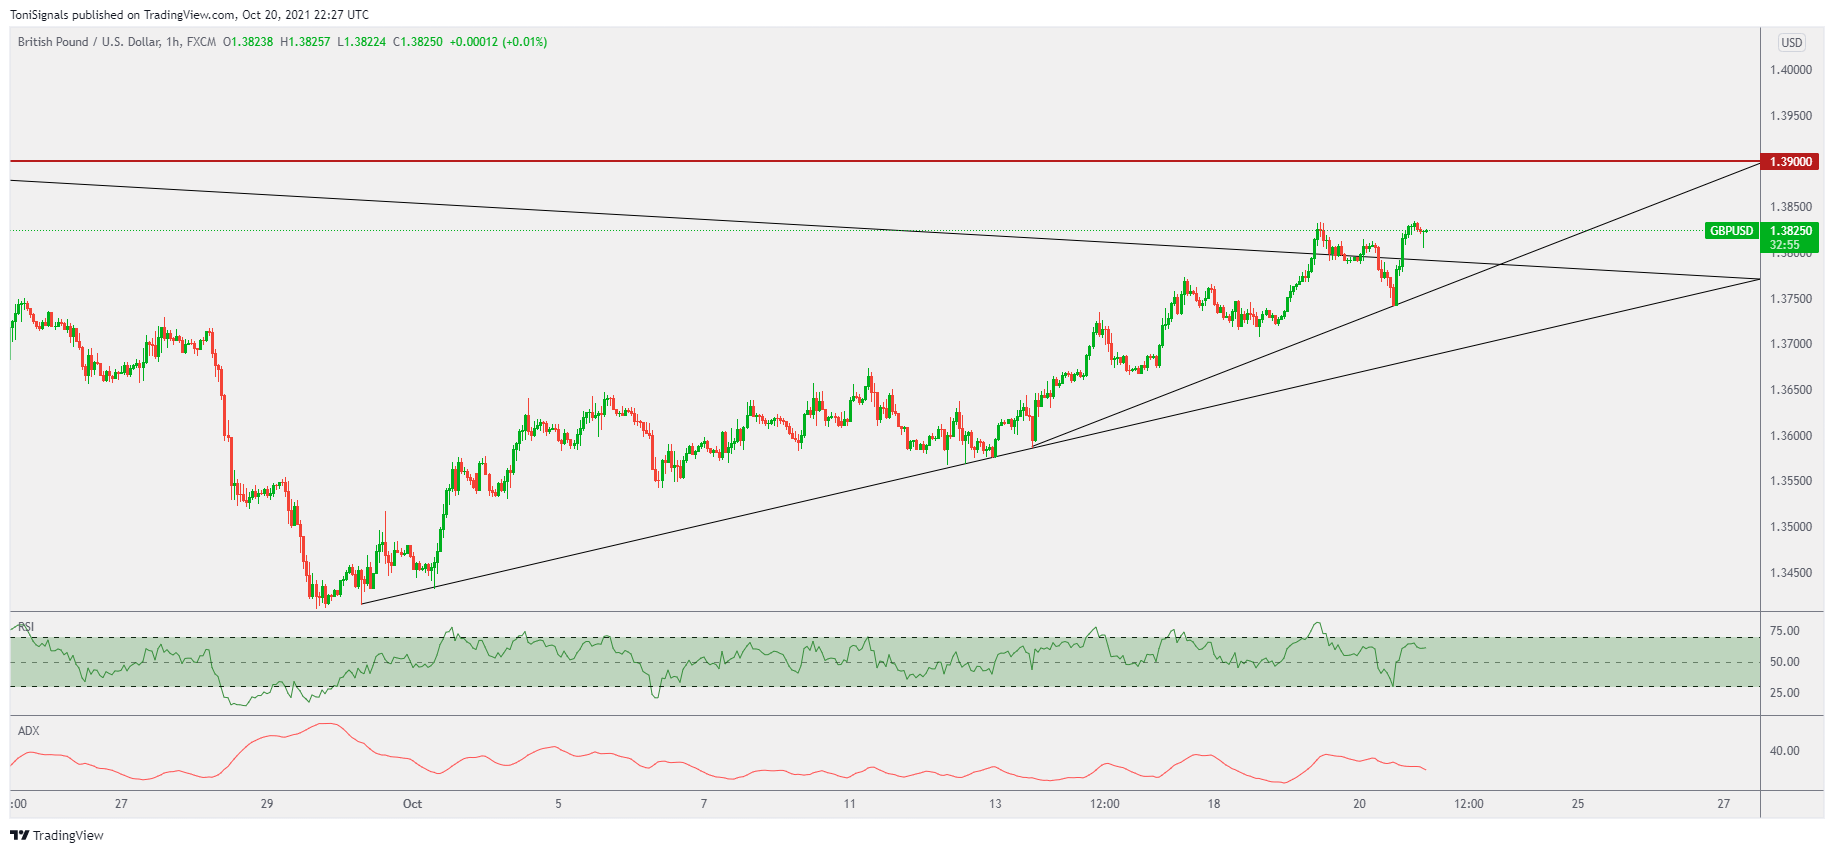
GBPUSD
1D Chart
Price has broken above the resistance trendline and retested it. Now we anticipate a move into the 1.3900 monthly resistance level.

1H Chart
Price is holding bullish however is struggling to break above current highs at 1.3830.
USDJPY
1D Chart
USDJPY Has traded into multi year highs and is now at a historic resistance. We are looking for a break or bounce situation, and our bias leans towards this zone breaking. We are bullish on USDJPY still.

1H Chart
Price is forming an ascending channel whilst trading high above the base trendline. Price has now bounces from channel support, and we are looking for a move back into the resistance.

XAUUSD
1H Chart
Price has bounced from structure resistance. Price has been ranging for a number of days, and we are waiting to see if price bounces from the resistance trendline.
