Lesson 9
The Relative Strength Index (RSI) is a widely used oscillator for traders performing technical analyses on the forex market. Because RSI replicates the line chart of the price in question, it is very easy to understand.
When a forex pair is ranging, the RSI could be helpful when trading from the overbought or oversold levels.
The Relative Strength Index was developed by J. Welles Wilder. It is also referred to as Wilders RSI and is a momentum indicator. The indicator measures the rate of change of the price movement. As with all oscillators, the RSI oscillates around the 0 and 100 levels.
With the RSI, the 50-level is considered the mid-point. When the RSI rises above the 50-level, the momentum is seen as rising. Similarly, when the RSI falls below 50, the momentum is seen as weakening.
How to trade with RSI
As with all oscillators, the RSI determines the overbought and oversold levels in the market. When the RSI value rises above 70, the markets are deemed to be in overbought condition, and thus, the indicator signals momentum could slow.
Similarly, the RSI value falling below 30 signals the market is in oversold condition. Therefore, it signals prices could start to rise again as momentum increases.
There are many different ways one can trade with the RSI. In addition to the overbought and oversold levels, the RSI is also commonly used to detect divergence in price, and it is also used as a momentum indicator to pick turning points in a trend as well as the dips and peaks in a rally and in a decline.
The RSI is also used as a resistance and support indicator when values of 80, 60, 40 and 20 are used. However, in this lesson, we will touch upon the basic concept of using the RSI as an overbought and oversold level. The default values of 70 and 30 and the RSI setting of 14 are used.
These levels mostly occur when the markets are in a ranging price action or moving sideways. Traders can either trade the range or wait for a breakout from the range.
How to use RSI in Forex
There are a number of ways to use the RSI indicator in the forex markets. For example, the RSI's divergence in price is one of the common ways traders use to find corrections in price.
Divergence occurs usually near the top end of a rally or near the bottom end of a decline. Price action often tends to post a correction or even a reversal after a sharp uptrend or a downtrend.
The RSI is used alongside trend indicators, such as moving averages. Because the RSI measures momentum of price, traders look for the oversold levels below 30 to be reached in an uptrend and then buy into the rally.
Similarly, in a downtrend, traders wait for overbought conditions, as shown by the oscillator values above 70, and then sell into the decline.
Overbought and oversold levels
The RSI oscillator moves within the 0 and 100 levels. However, when it is above 70, the market is said to be in overbought conditions. When it falls below 30, the indicator is said to be in an oversold condition.
The oscillator values are based on the relative change of the average upward price change divided by the average downward price change. The default setting for the RSI is 14 periods, but other common settings include 7 or even 5.
Although the RSI often reverses from the 70 level or near the 30 level, it continues to remain overbought or oversold for prolonged periods of time. Therefore, traders should be cautious and should not expect or assume that price will correct every time the RSI is above or below the overbought or oversold levels.
RSI trading strategy
The indicator is popular among all kind of traders, and there are many RSI-based trading strategies. In the following example, we will simply make use of the RSI's overbought and oversold levels in the forex market.
The trading rules are simple. We look at the 4-hour chart and add the 14-period RSI. We wait for the RSI to fall below 30 or rise above 70. Then, when it moves back above 30 or below 70, we go either Long or Short on the market.
RSI Buy Signal
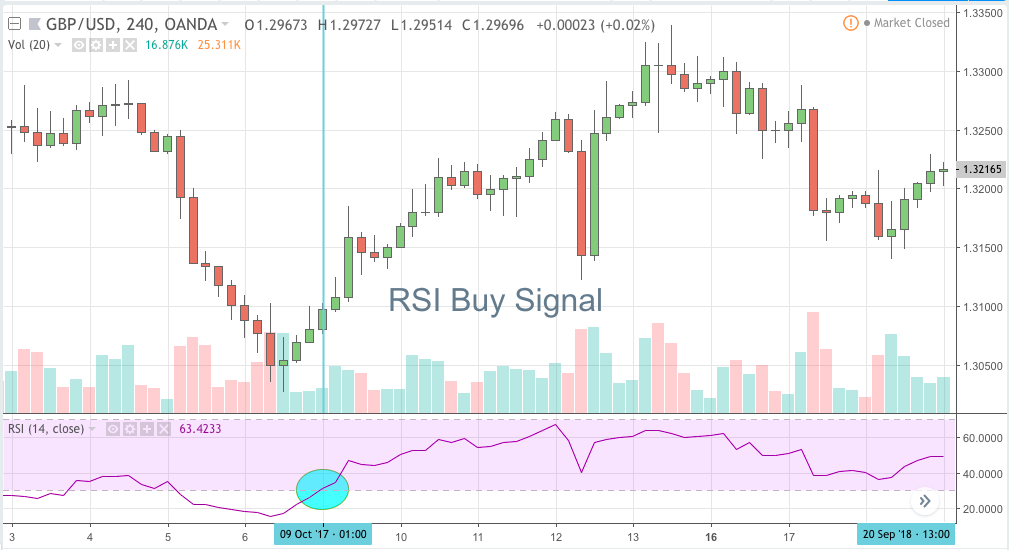
In the GBPUSD example above, we can see the RSI falls below the 30 level. After the decline, we then see the RSI moves back above the 30 level. At the close of this candle, we can buy GBPUSD.
RSI Sell Signal

In the next example, we have a sell signal on GBPUSD. We first wait for the RSI to rise above the 70 level. Then, we wait for it to fall back below the 70 level. Following this, we might sell the currency pair.
The above RSI trading strategy is quite simple. However, note that traders will need to closely watch their charts and price action to successfully trade forex. It might take a few hours for the RSI to fall back or rise above the 70 and 30 levels, respectively.
Patience is always important as traders need to first wait for the right conditions and then buy or sell after the conditions are met. The RSI oscillator is a simple and powerful momentum indicator. With due practice, traders can hone their skills and use the indicator to trade forex.
However, trading a range market can be very risky as price often tends to move into the accumulation phase. Traders can often end up getting trapped due to fake breakouts, which are a common occurrence with the RSI indicator.