Best Forex Indicators
Monthly pivot levels are one of the strongest confluences to add into your forex trading strategy, and are often overlooked. Monthly pivot levels are used by a wide variety of institutional traders, and when used properly can considerably improve your trading results.
What Is A Monthly Pivot Level?
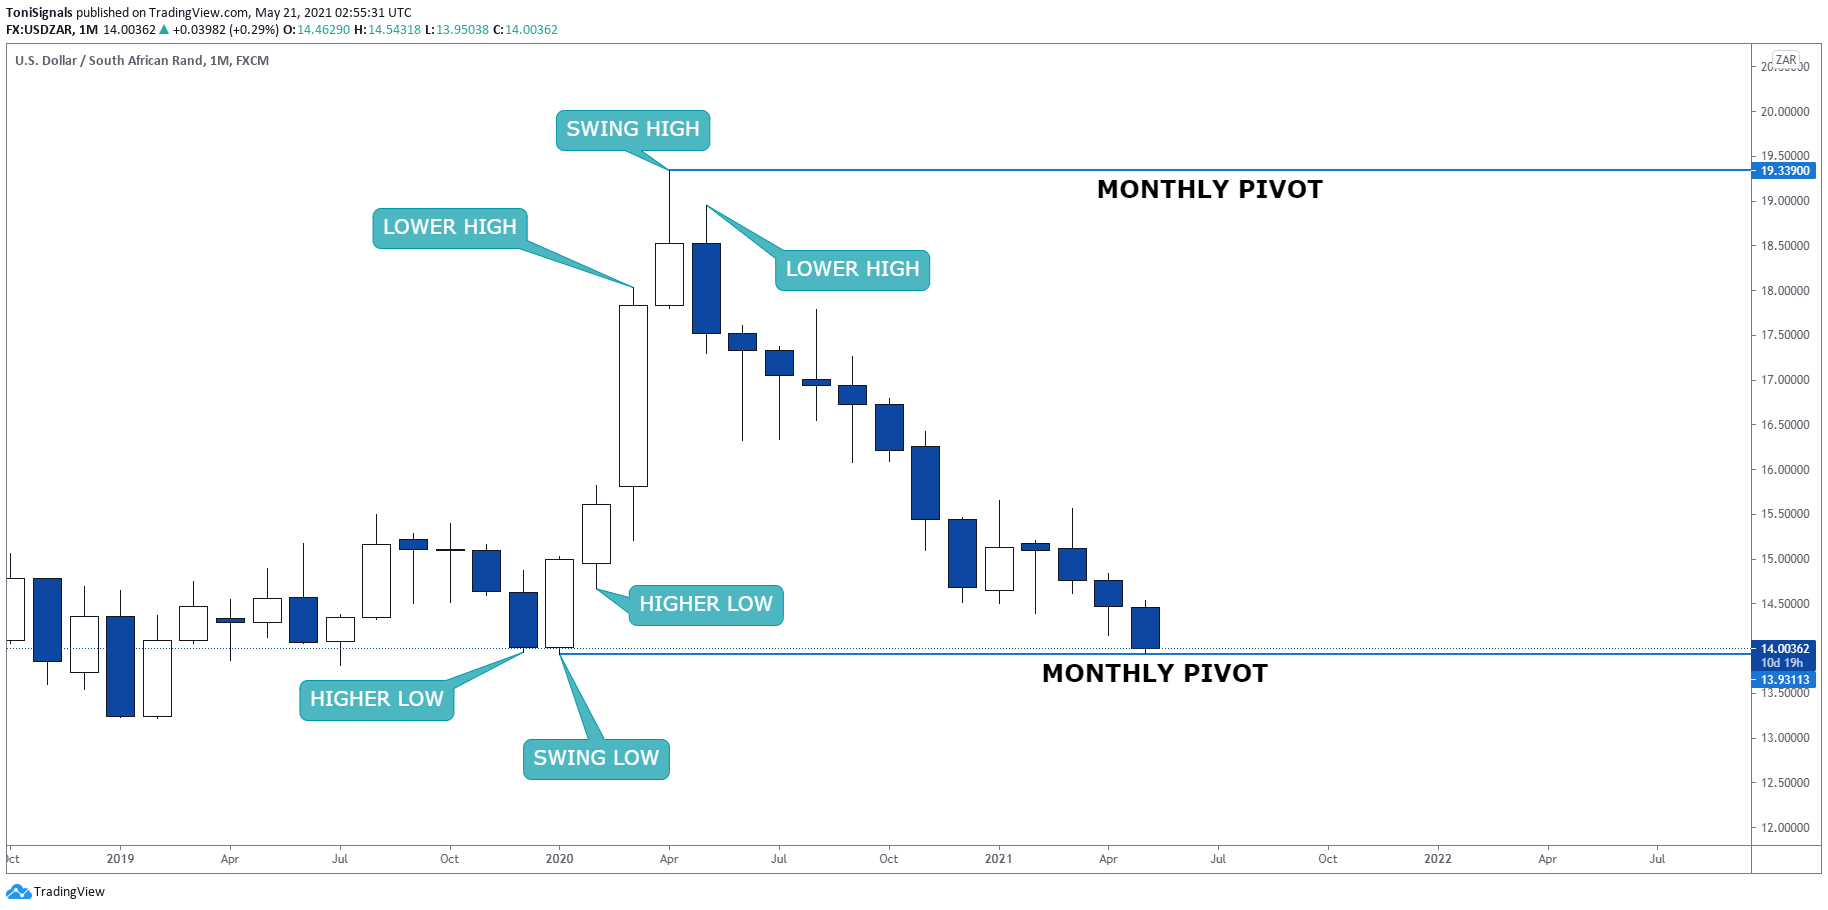
A monthly pivot level is a level that price reached and reversed from. This is either a swing high or a swing low on a monthly chart. For a swing high pivot to form there must be a candle on either side of the swing high candle, both with a lower high. For a swing low point to form there must be a candle with a higher low on either side of the pivot candle. As we’re talking about monthly pivots, these are found on the monthly chart, where each candle represents one month of trading. Below you can see an example of identifying swing points on a monthly chart.
Plotting Monthly Pivot Levels On Your Forex Chart
For a trading exercise plot the previous 3 years monthly pivot levels on a chart. Try and be as precise as possible and locate all pivot points, even if they didn’t have a large reaction away from the price. Once you’ve added the pivot points your chart should look something like the one below. The chart shows 2017-2019 monthly pivot levels for AUDCHF.

Monthly Pivots in Practice
Using the same AUDCHF chart but on the daily timeframe lets have a look at how price in 2020 respects the previous 3 years pivot levels. As you can see price has pivoted at these levels a large number of times throughout the following year. Whilst using monthly pivots as a forex trading confluence requires patience, they are a highly effective tool to add to your forex toolkit.
