Here's Our Chart Analysis for 2 November 2021
The new month has some hot technical setups, so read on to find out what charts have some great opportunities!
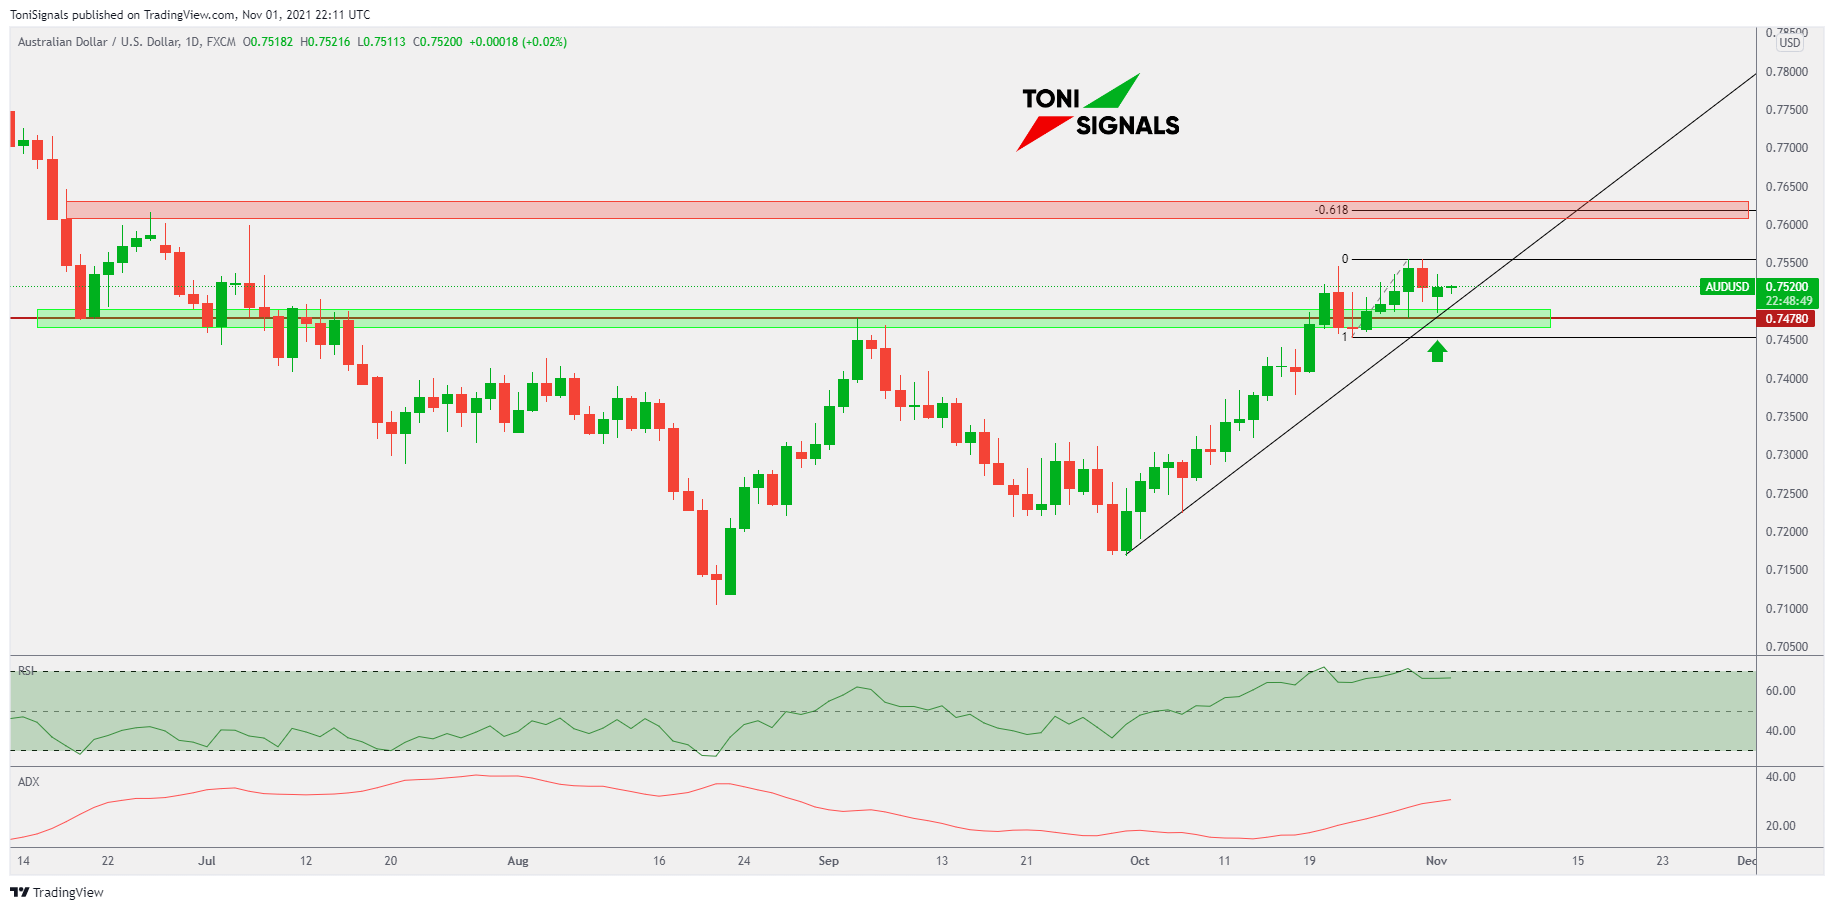
AUD/USD
1D Chart
Price has bounced from the support zone yesterday, and we're eying upside into the 61.8% fibonacci extension, which correlates with previous resistance.
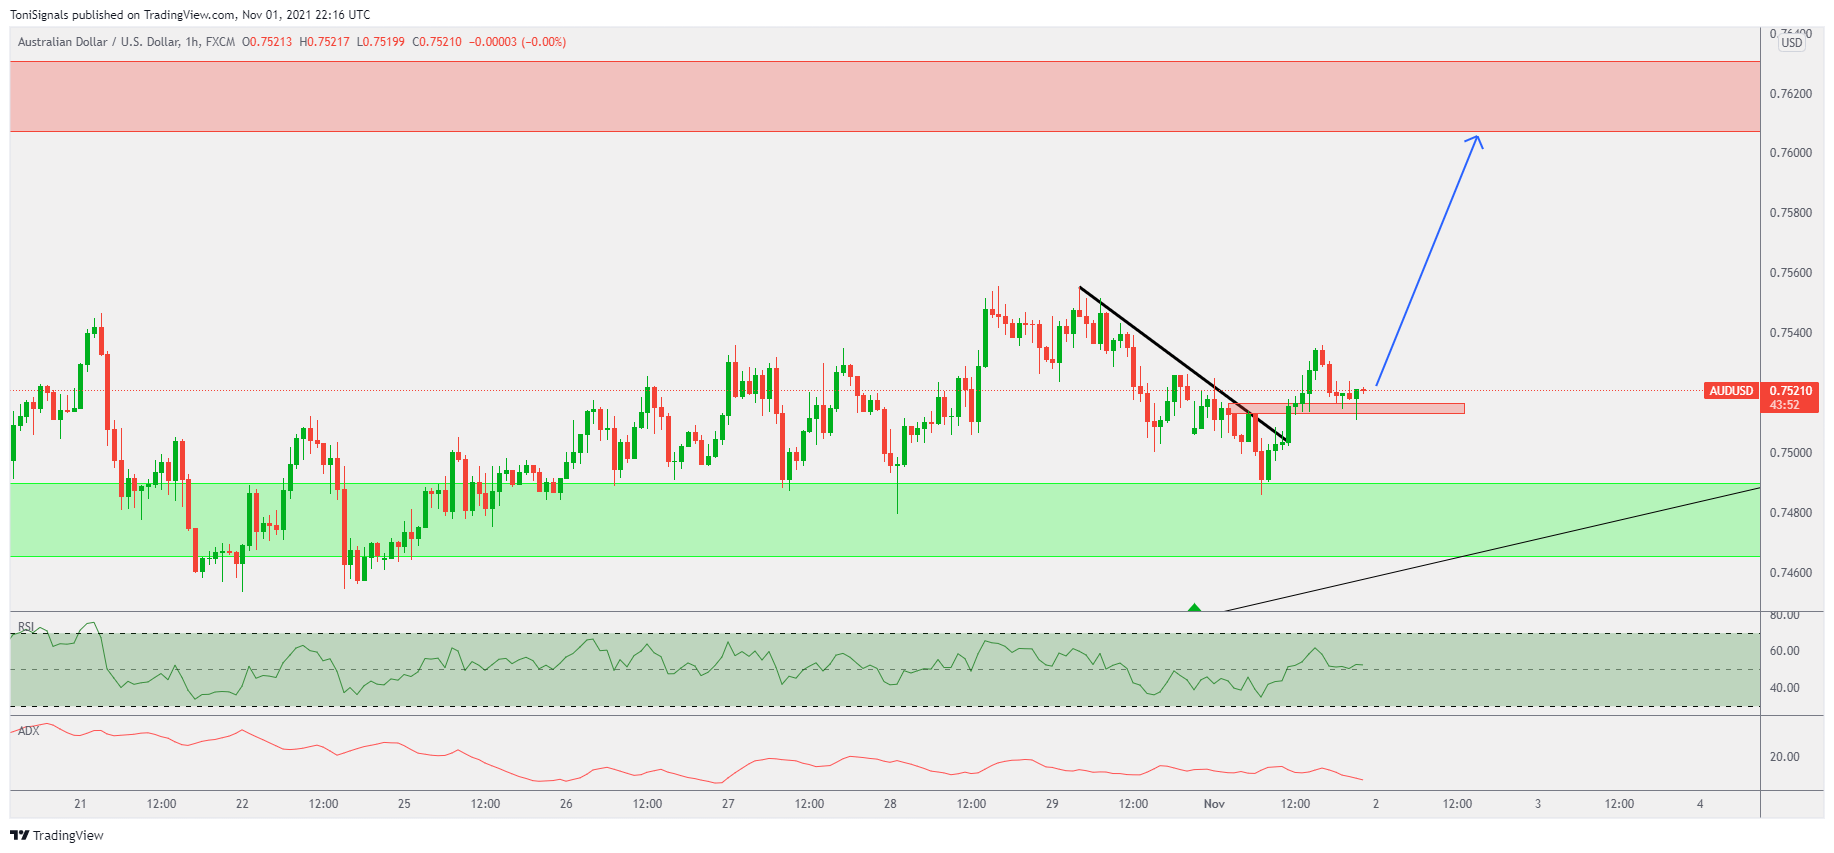
1H Chart
On the 1h chart price has broken into a bullish structure, and is forming support candlestick patterns. We anticipate an upside push from the current price into the 0.7600's.
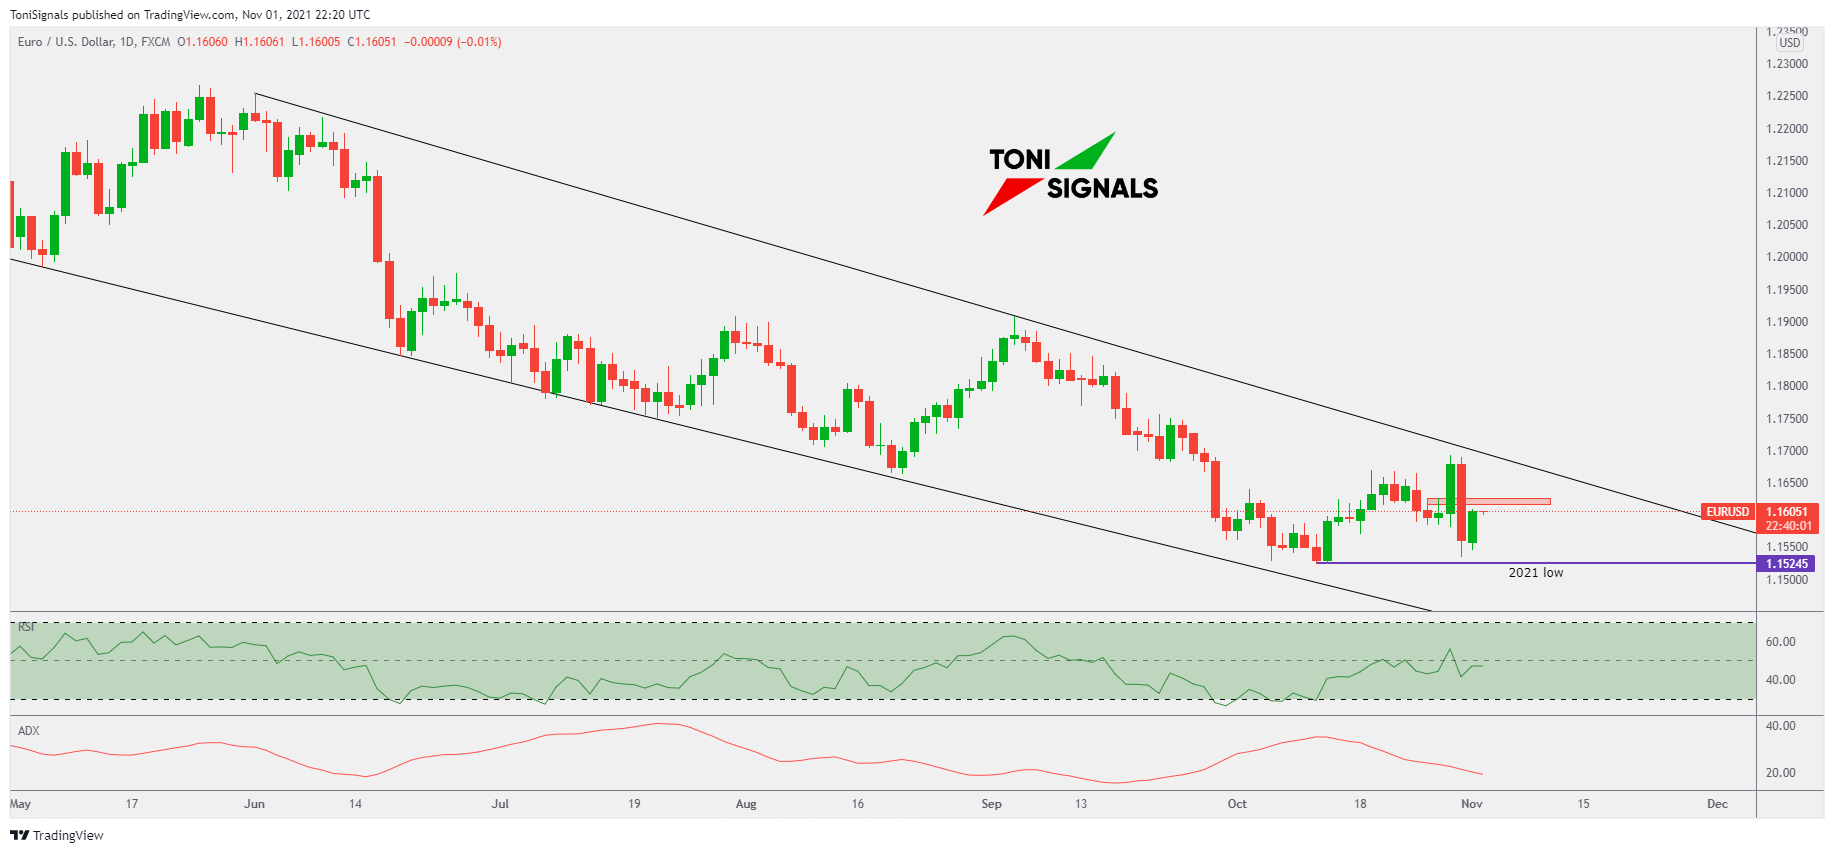
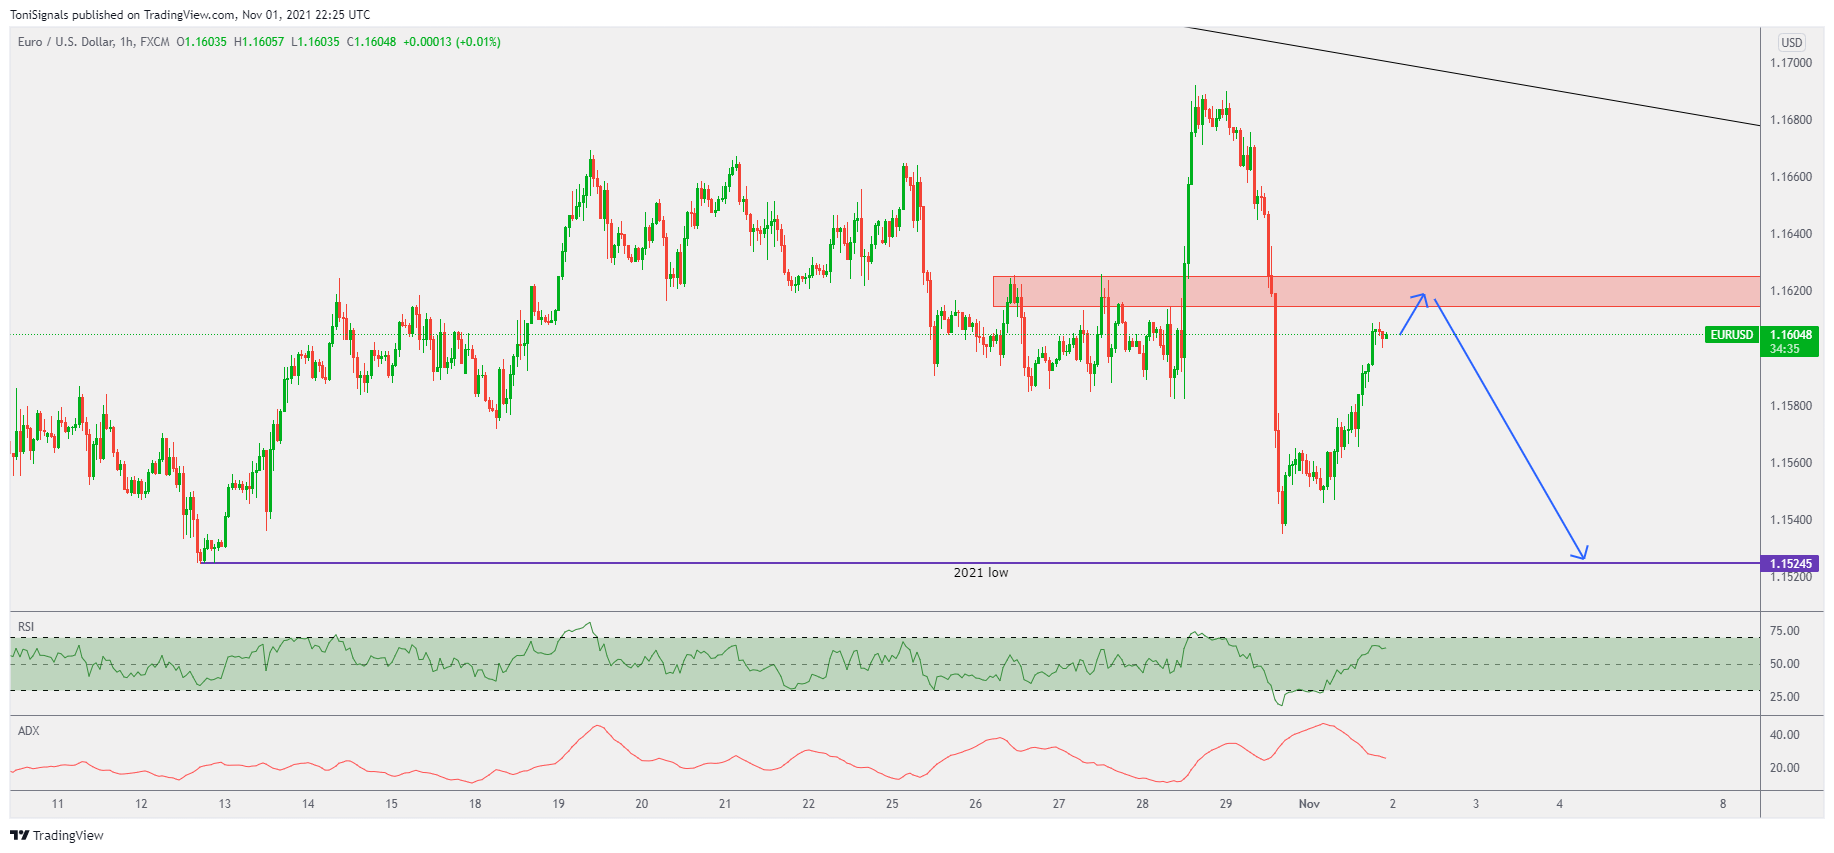
EUR/USD
1D Chart
EUR/USD has pulled back into the zone we outlined yesterday on the 1H chart. Now we are looking for price to test above this zone, and our bias is that it will reject upside above the zone.
1H Chart
Price is approaching the resistance we outlined yesterday, and we are looking for price to trade into this zone and then for a bounce showing that resistance is holding.
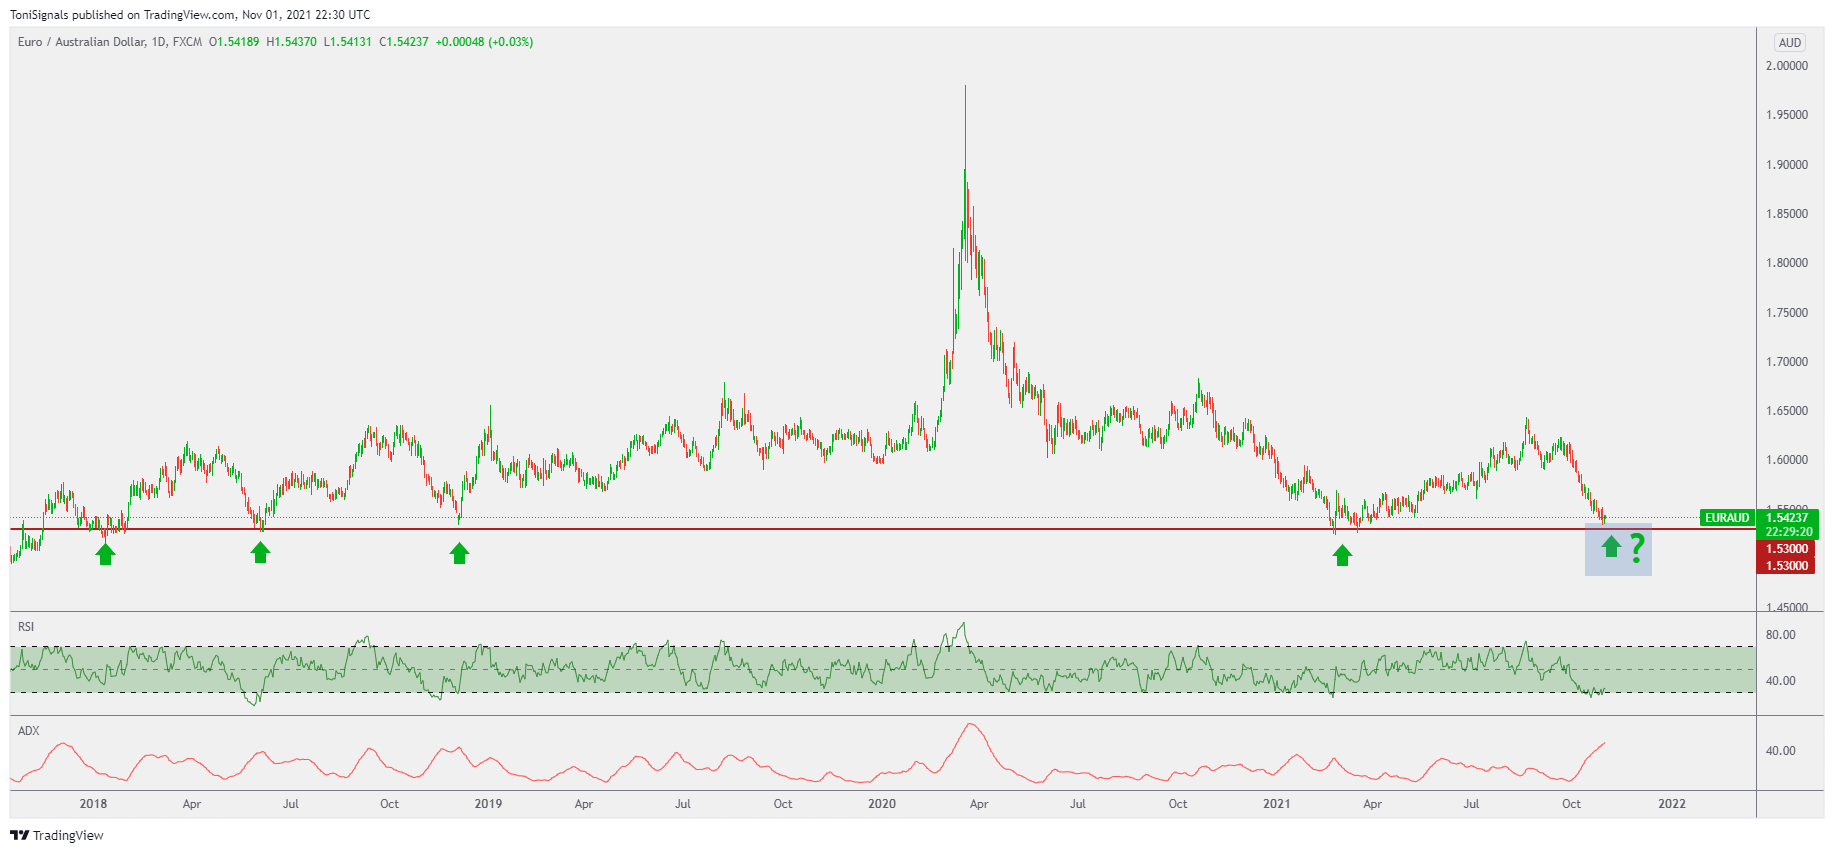
EUR/AUD
1D Chart
Price is approaching the key support at 1.5300 and we're extremely interested to see if price bounces or breaks. Price has not traded below this level since November 2013.
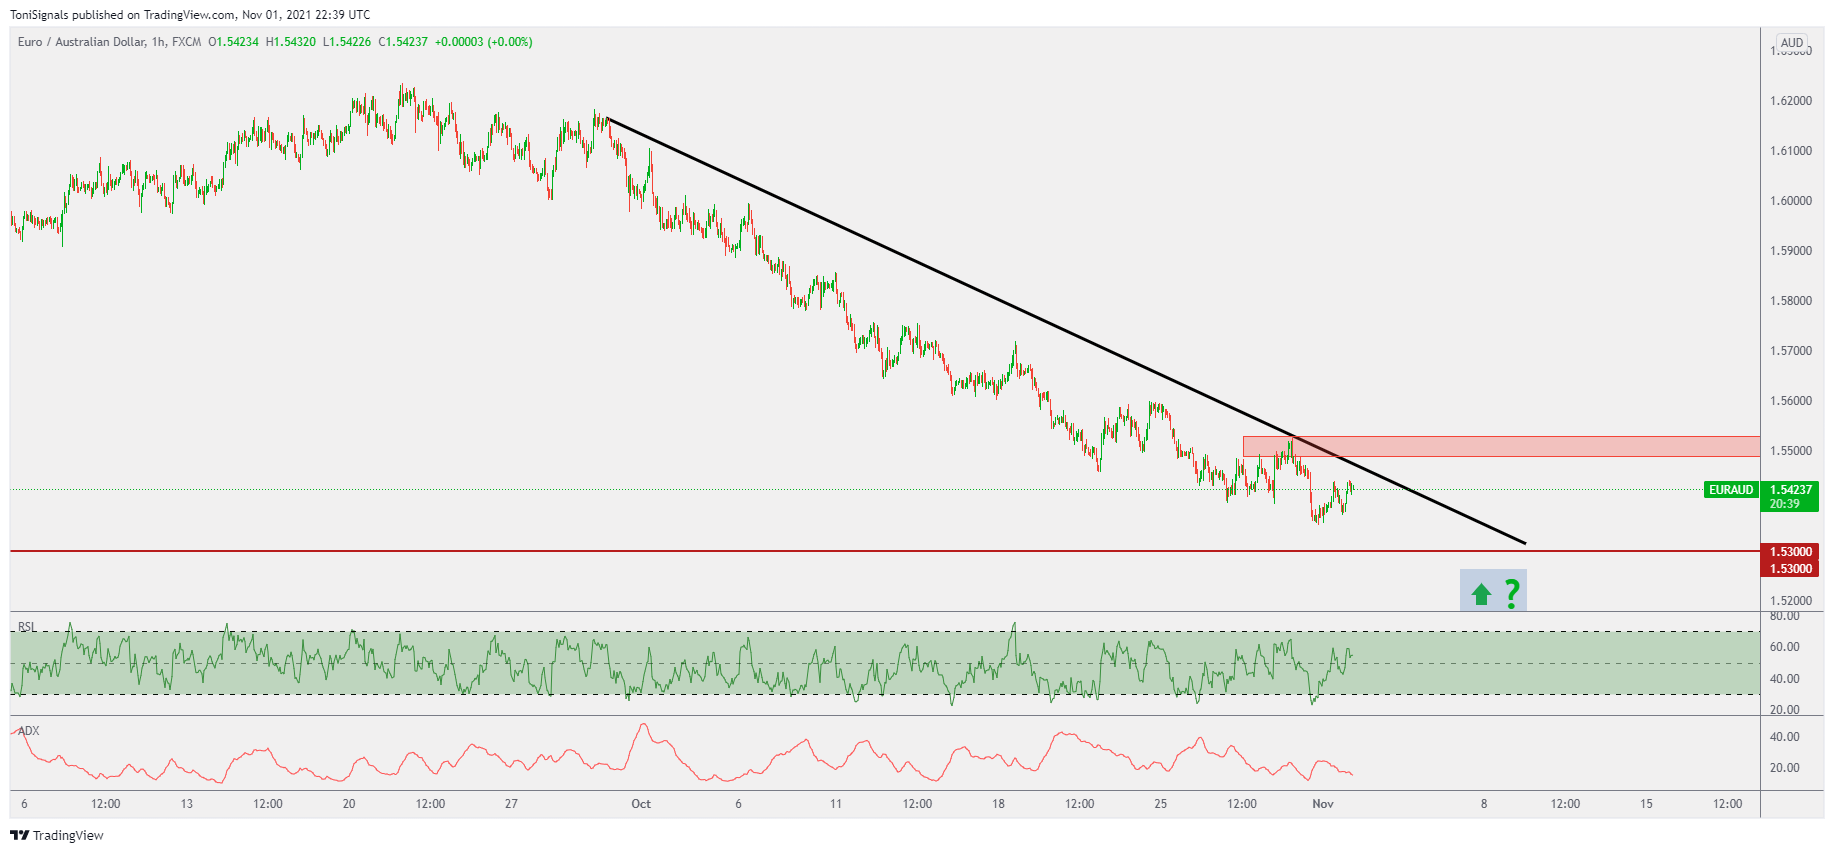
1H Chart
Price is capped by the resistance trendline still, and there is a key resistance zone around the 1.5500 level. We're looking for further downside into the 1.530 level before looking for a change in structure.
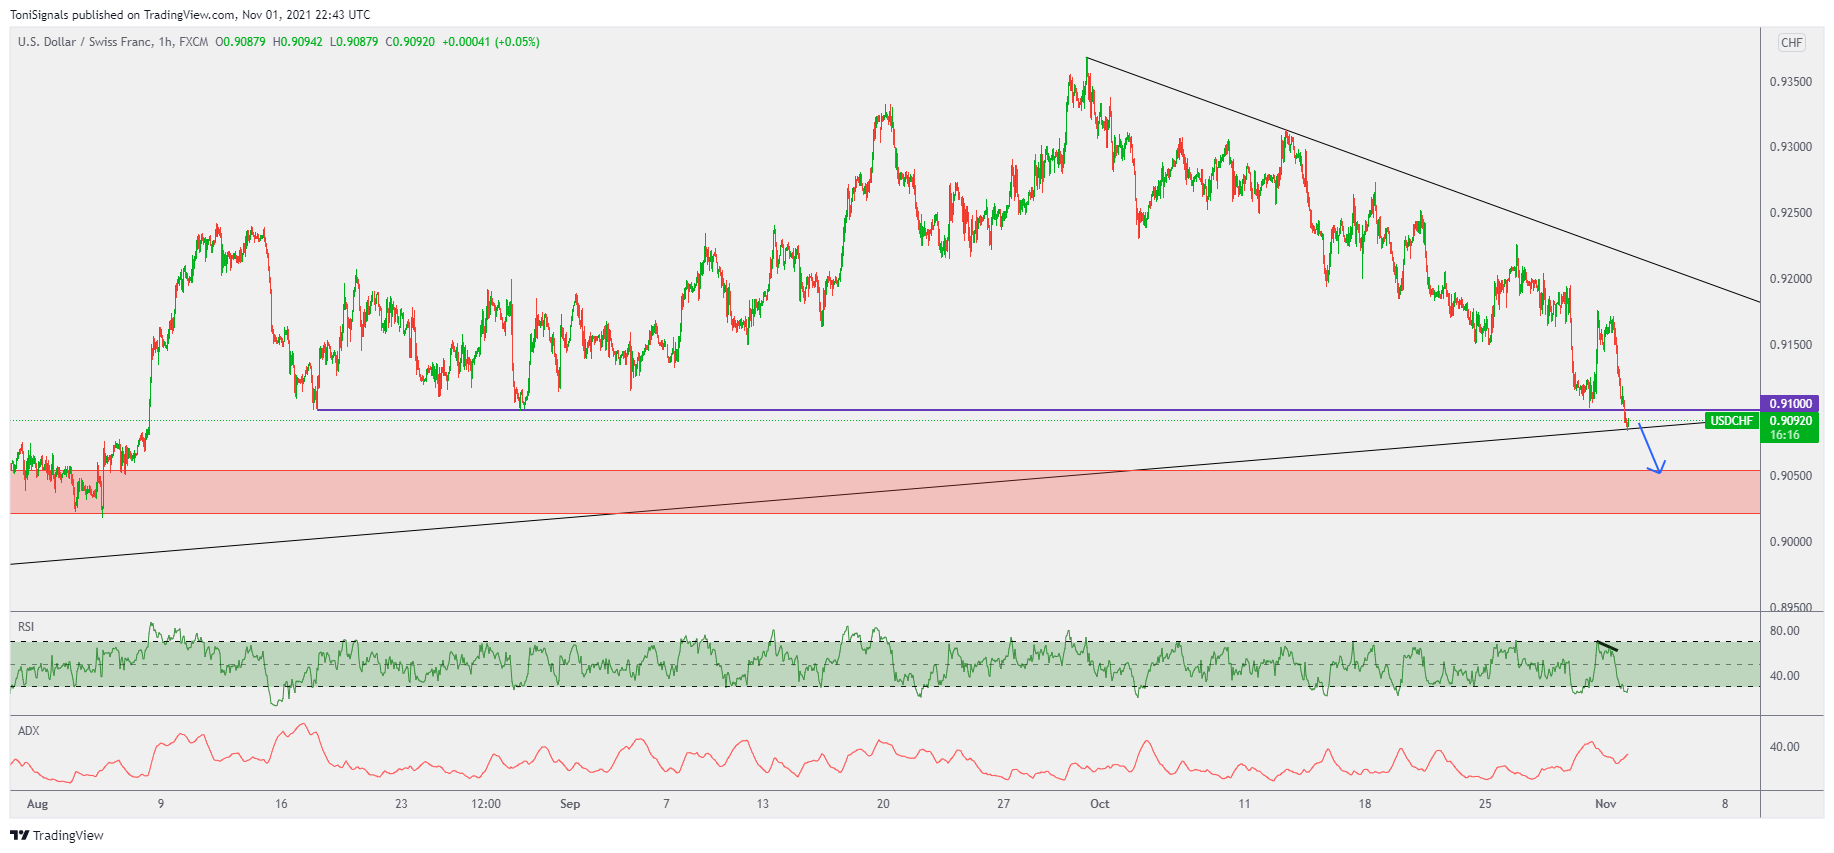
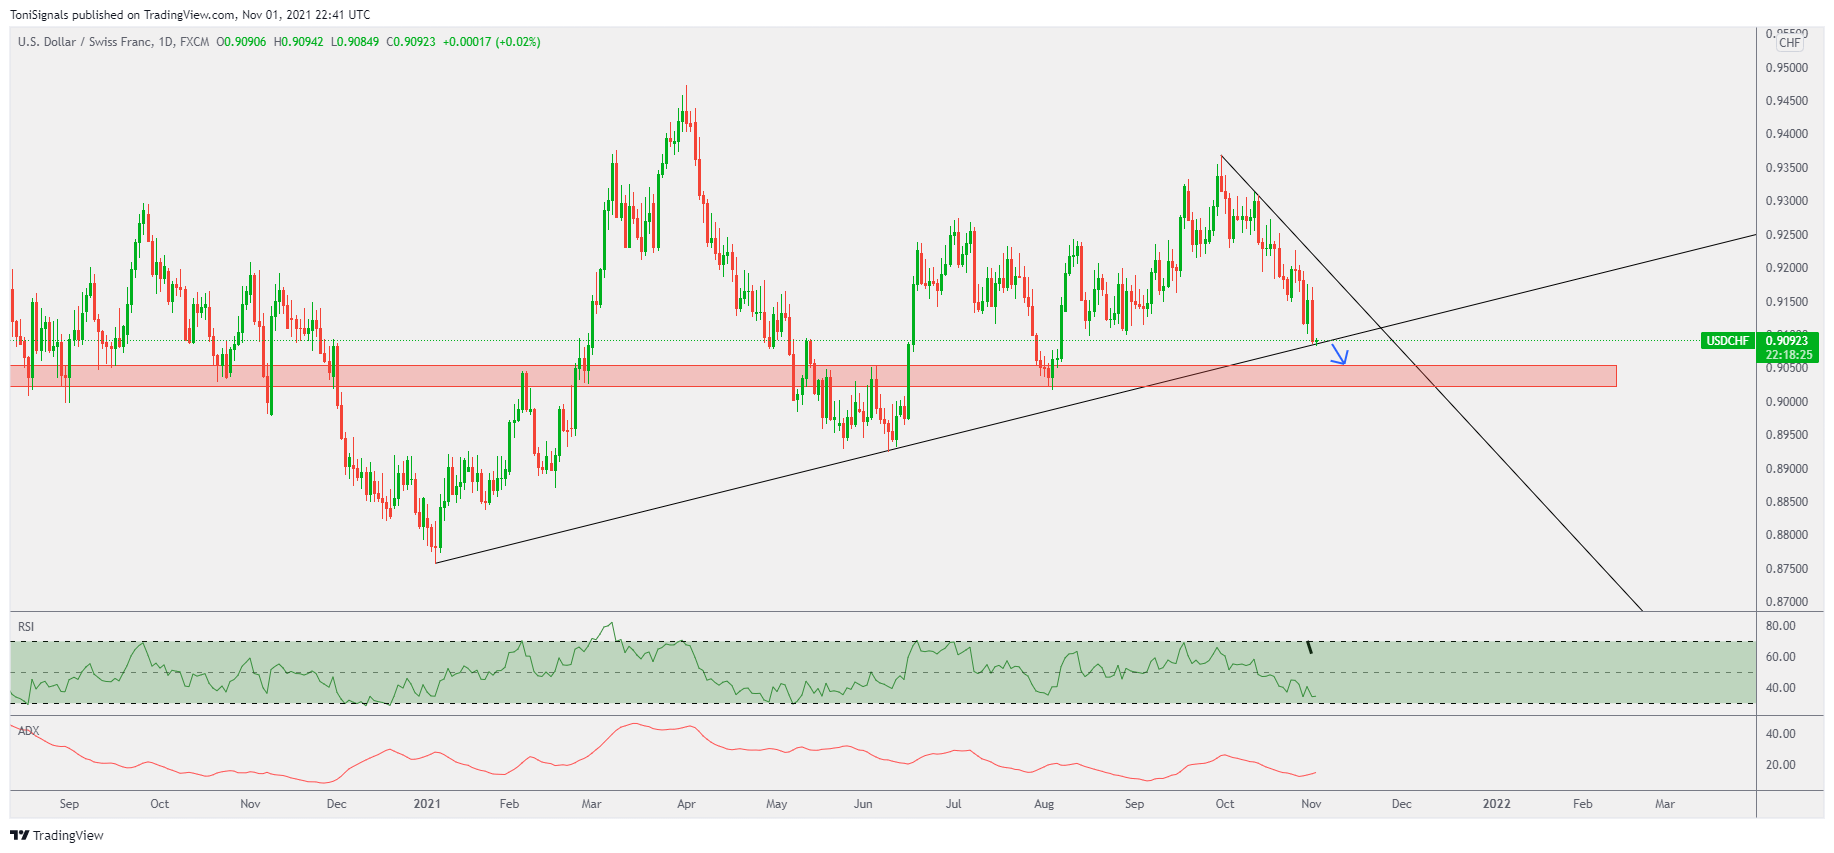
USD/CHF
1D Chart
Price is approaching trendline support but we are waiting to see if price will bounce from this level, or trade into the structure support below. We anticipate that price will break the trendline and trade into structure.
1H Chart
Nor that price has broken below the 0.9100 pivot, we anticipate downside to continue through the support trendline into the support zone.